Boomi Monitoring with Splunk
Implementation of Log Monitoring with Splunk
Overview
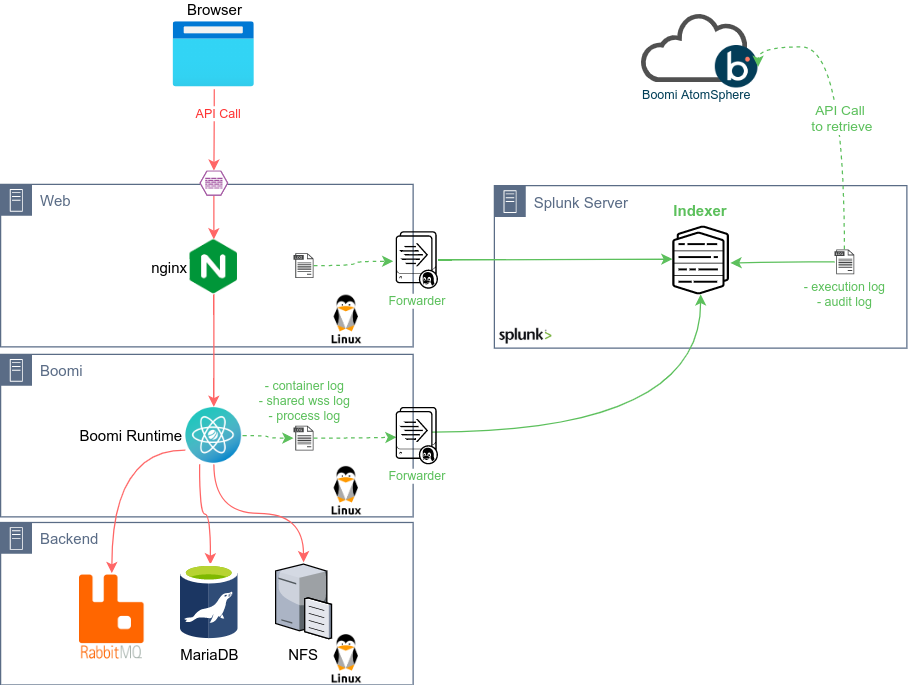
Basic Log Monitoring Setup
Boomi Runtime
A Splunk Forwarder instance will be running on the Atom/Molecule Node or on the Files Server (NFS Server used by the Molecule):
Example of inputs.conf
[monitor:/opt/Boomi_AtomSphere/Atom/Atom_Ubuntu1604/logs/*.container.log]
sourcetype = BoomiAtomContainerLog

[monitor:/opt/Boomi_AtomSphere/Atom/Atom_Ubuntu1604/logs/*.shared_http_server.log]
sourcetype = BoomiAtomWSSLog
...
Please see the full file here: inputs.conf
Splunk Server
Example of transforms.conf:
[BoomiGenericSourceReplacement]
SOURCE_KEY = MetaData:Source
DEST_KEY = MetaData:Source
REGEX = .*\/([^/]+)\.log
FORMAT = source::$1
...
Please see the full file here: transforms.conf
Example of props.conf:
[BoomiAtomContainerLog]
TRANSFORMS-BoomiGenericSourceReplacement = BoomiGenericSourceReplacement

[BoomiAtomWSSLog]
TRANSFORMS-BoomiGenericSourceReplacement = BoomiGenericSourceReplacement
...
Please see the full file here: props.conf
Advanced Log Monitoring Setup
For the advanced setup, we are also retrieving the Process Logs in XML as well as Execution Logs and Audit Logs from AtomSphere.
The last two files requires API calls to Boomi AtomSphere:
- Execution Logs, see https://help.boomi.com/bundle/developer_apis/page/r-atm-Execution_Summary_Record_object.html
- Audit Logs, see https://help.boomi.com/bundle/developer_apis/page/r-atm-Audit_Log_object.html
The API call can obviously be done in Boomi (API Call -> XML to CSV -> Persistence to the File Server) or by another API Client with a Scheduler.
Viewing Boomi Logs in Splunk
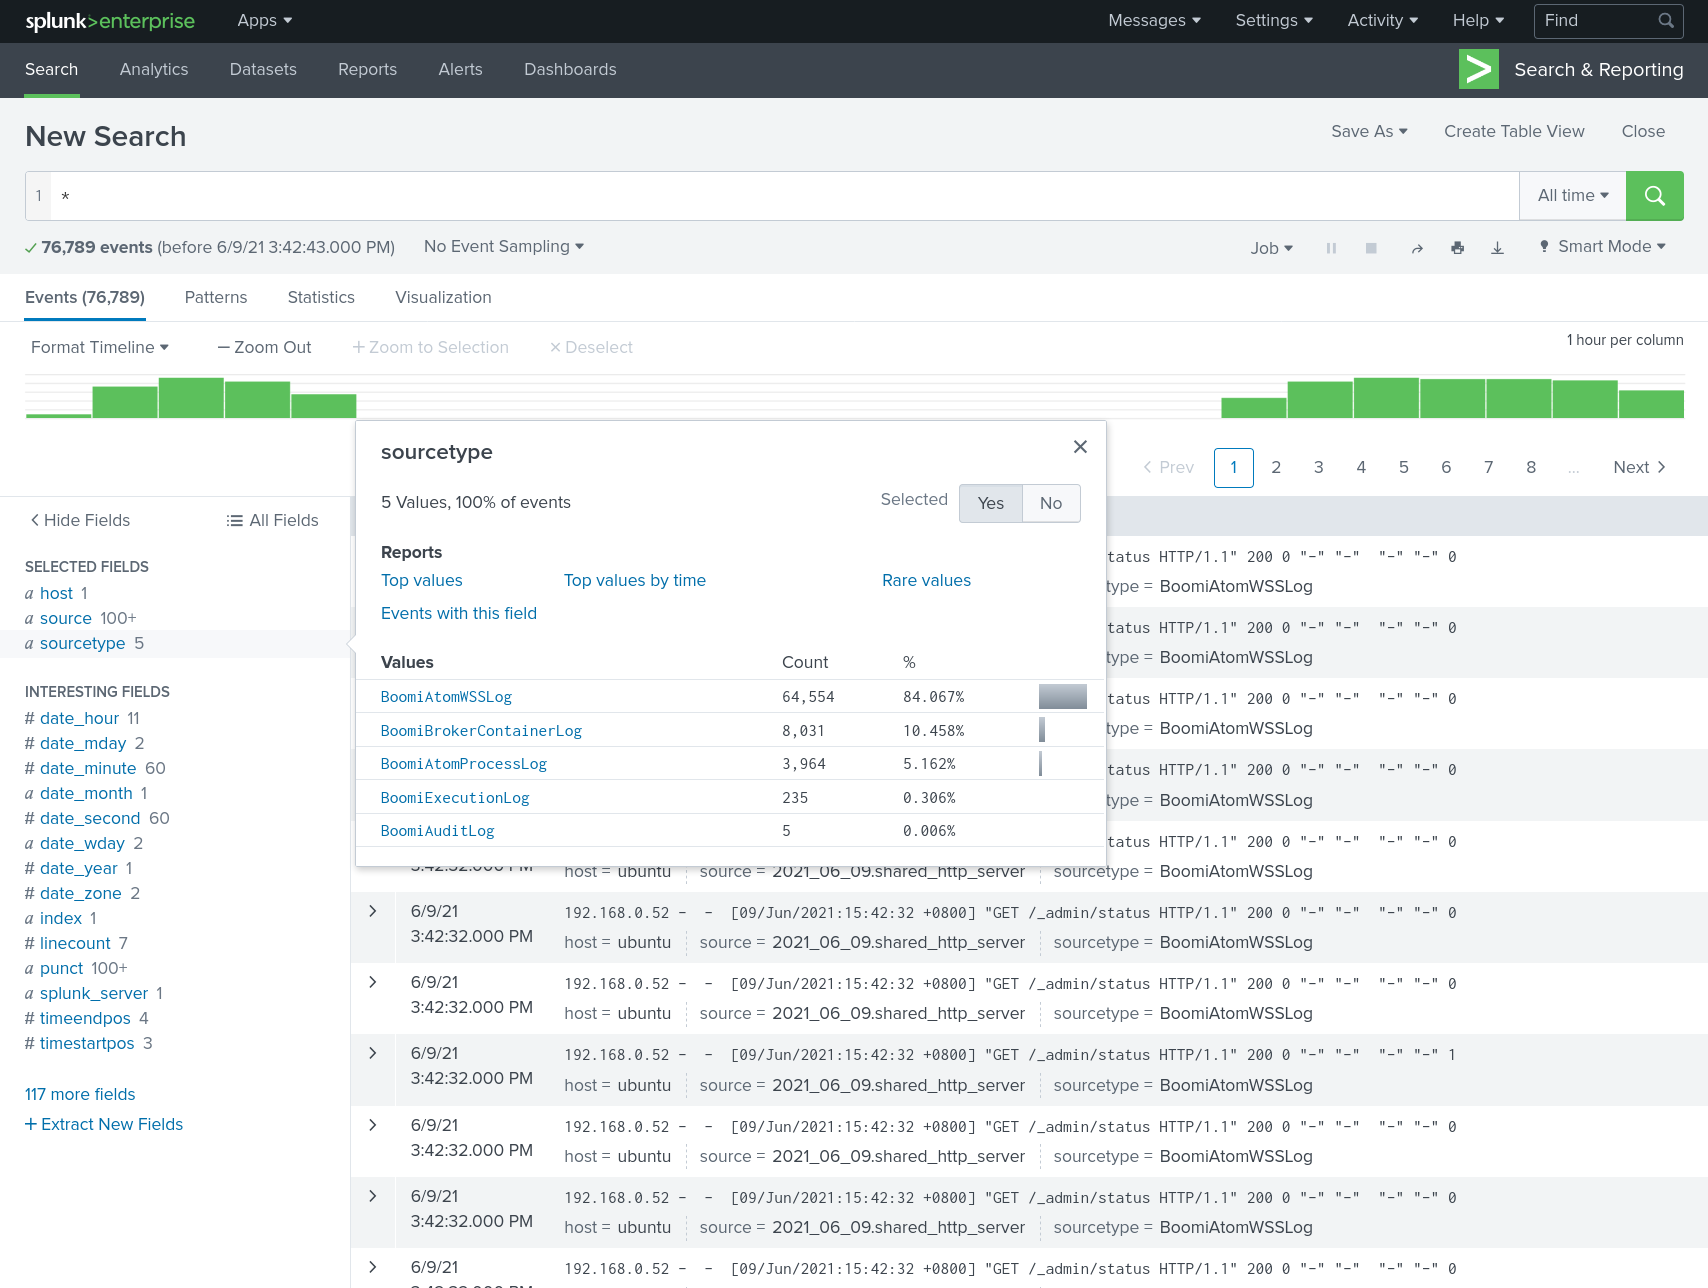
View of Source Types
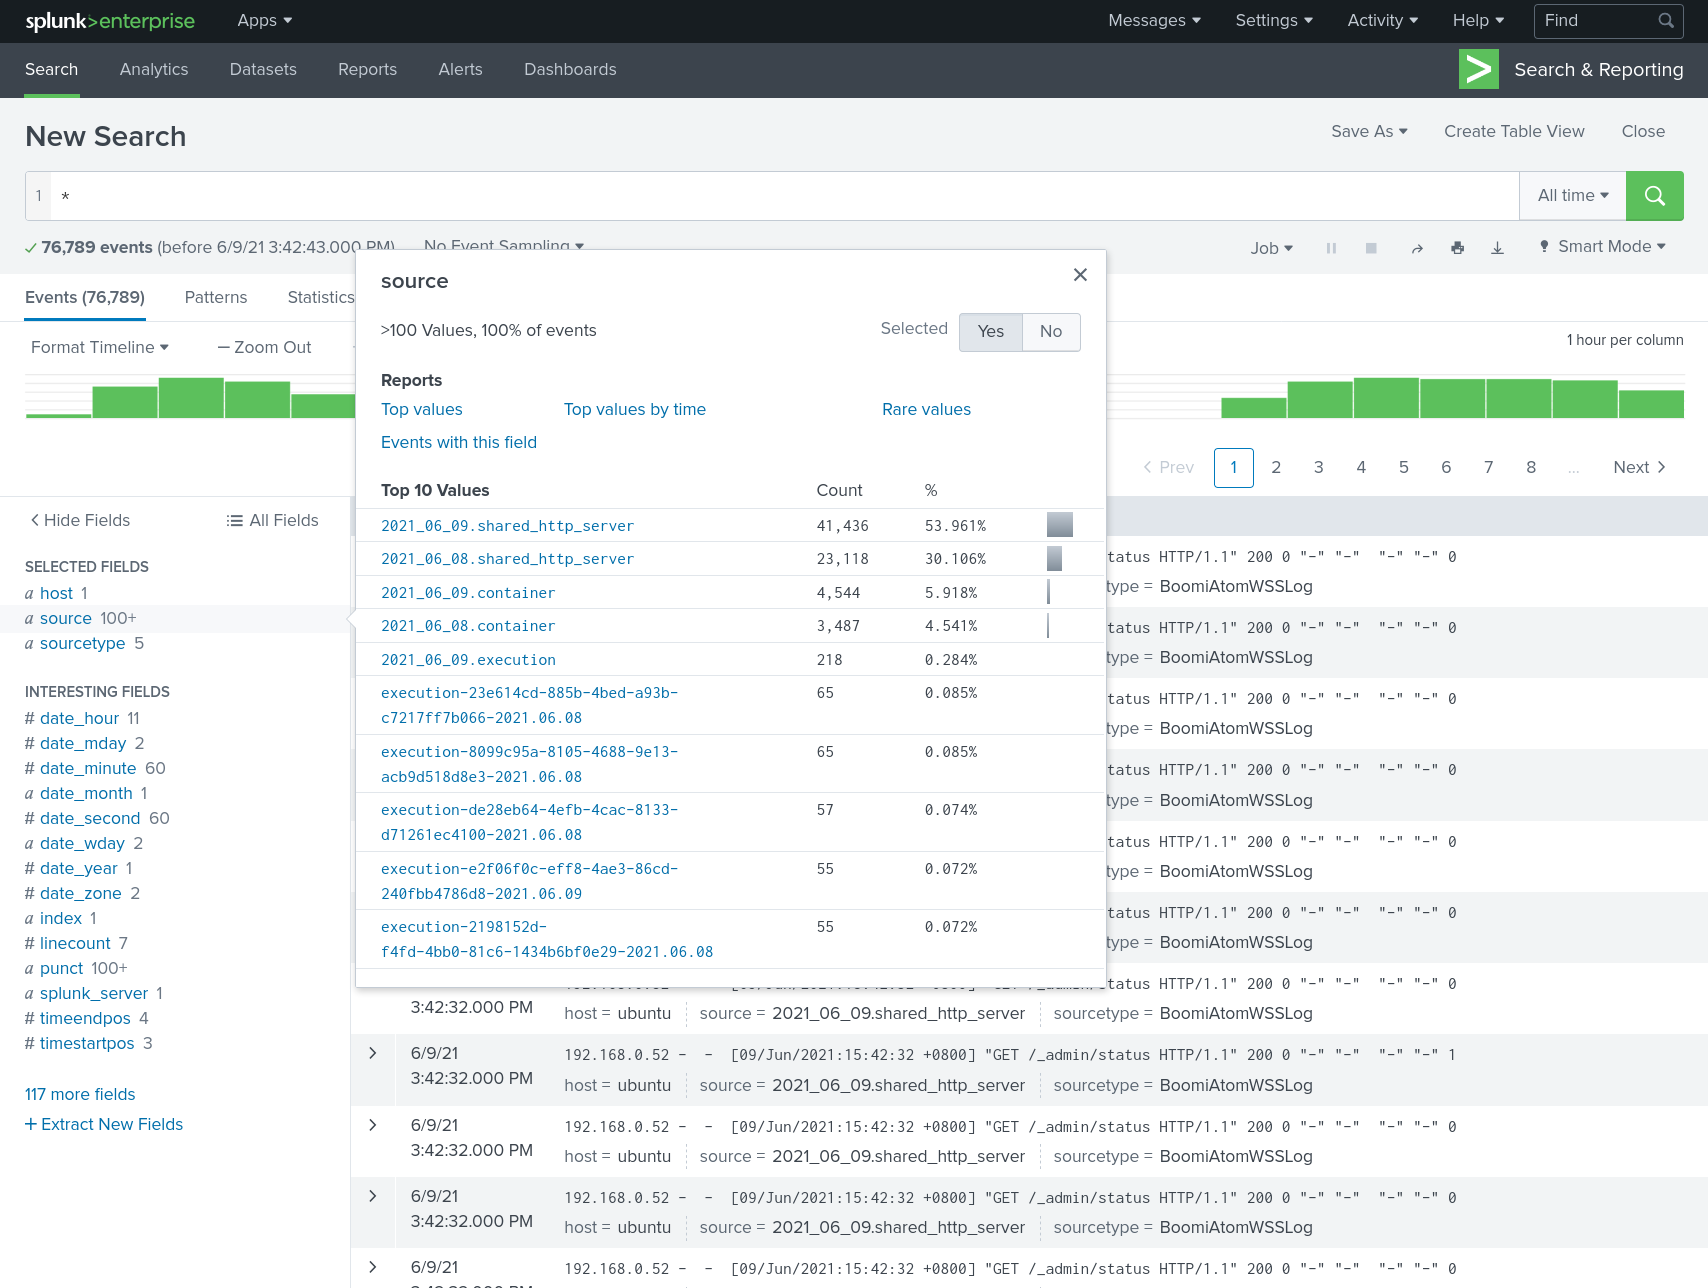
View of Sources
Dashboards
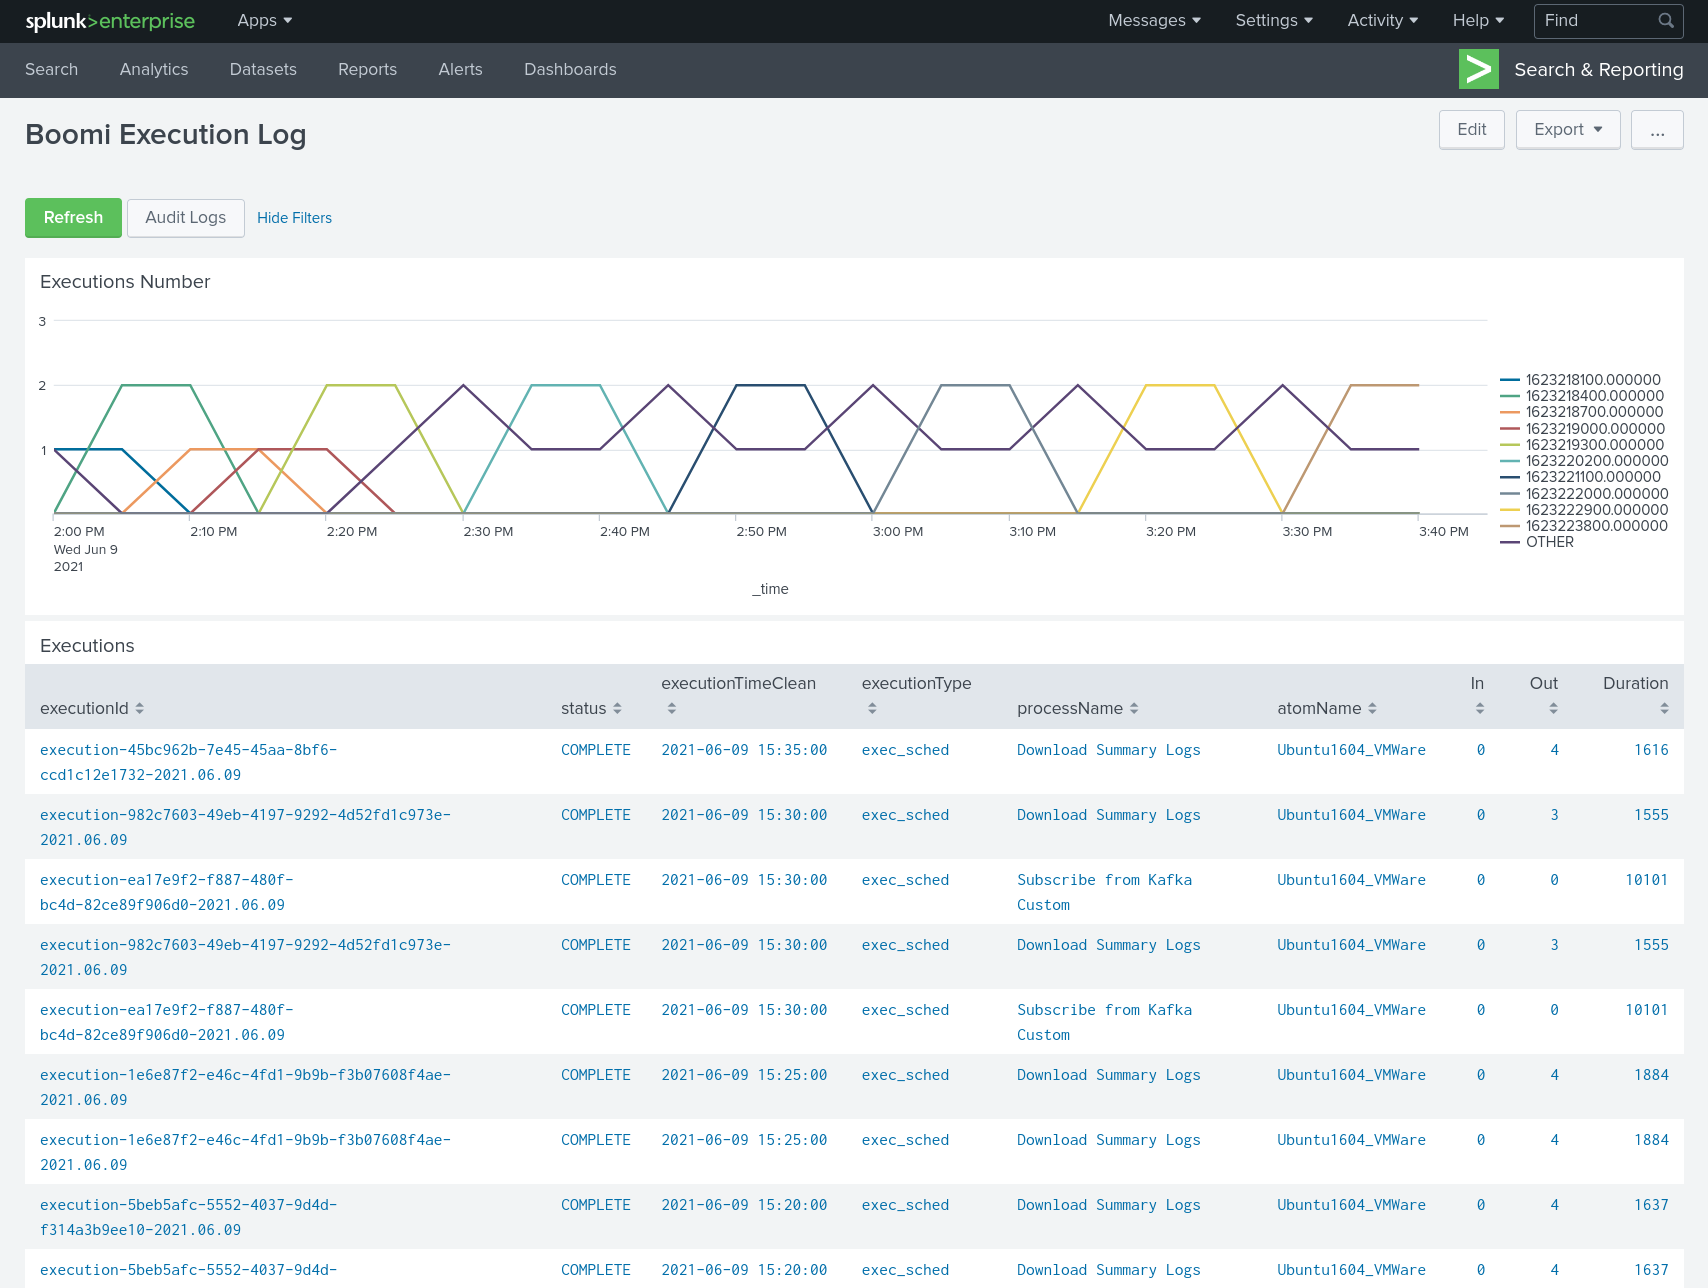
Once the Advanced Logs Monitoring setup is done, two dashboards can be created:
- Execution dashboard mimicking the Process Reporting of AtomSphere
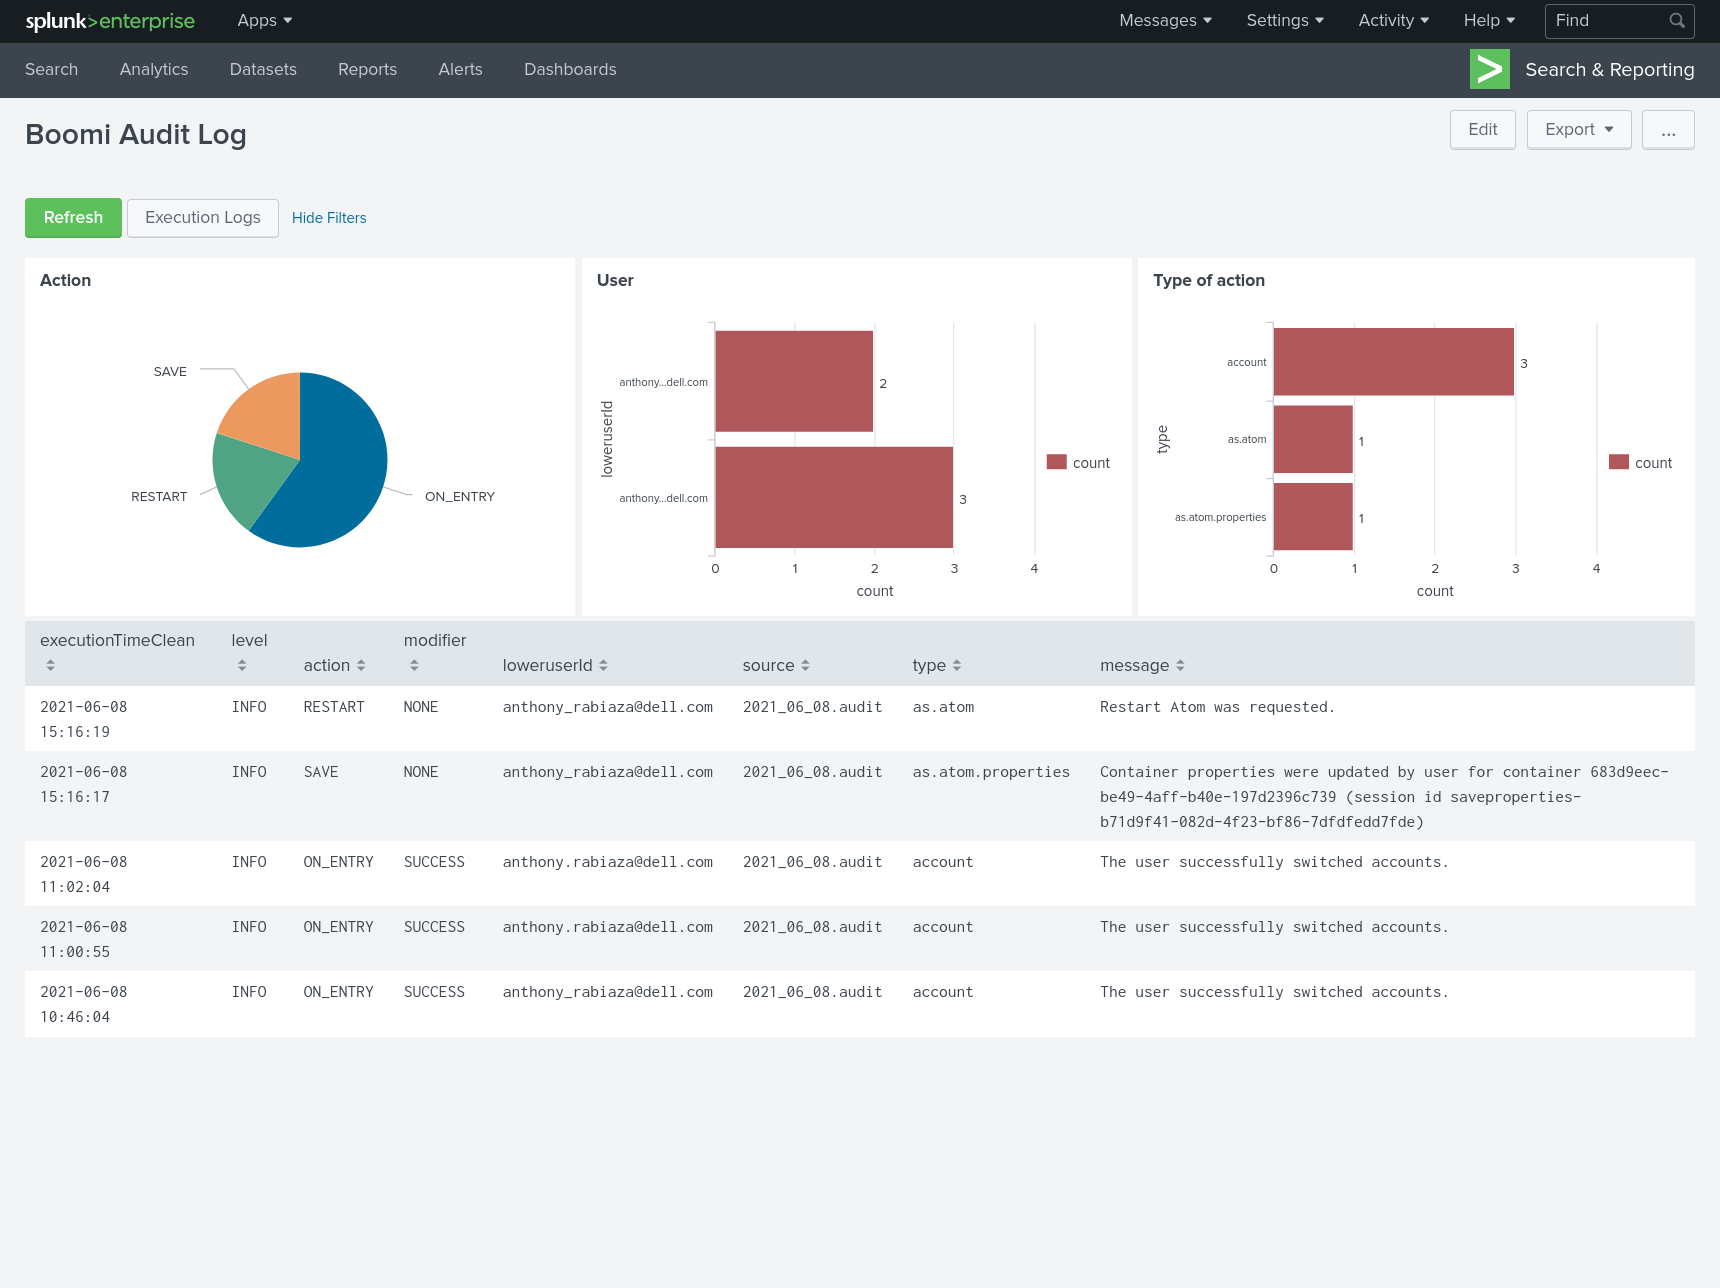
- Audit Log dashboard which will show all the Logs related to the actions on the AtomSphere Account
Execution Logs
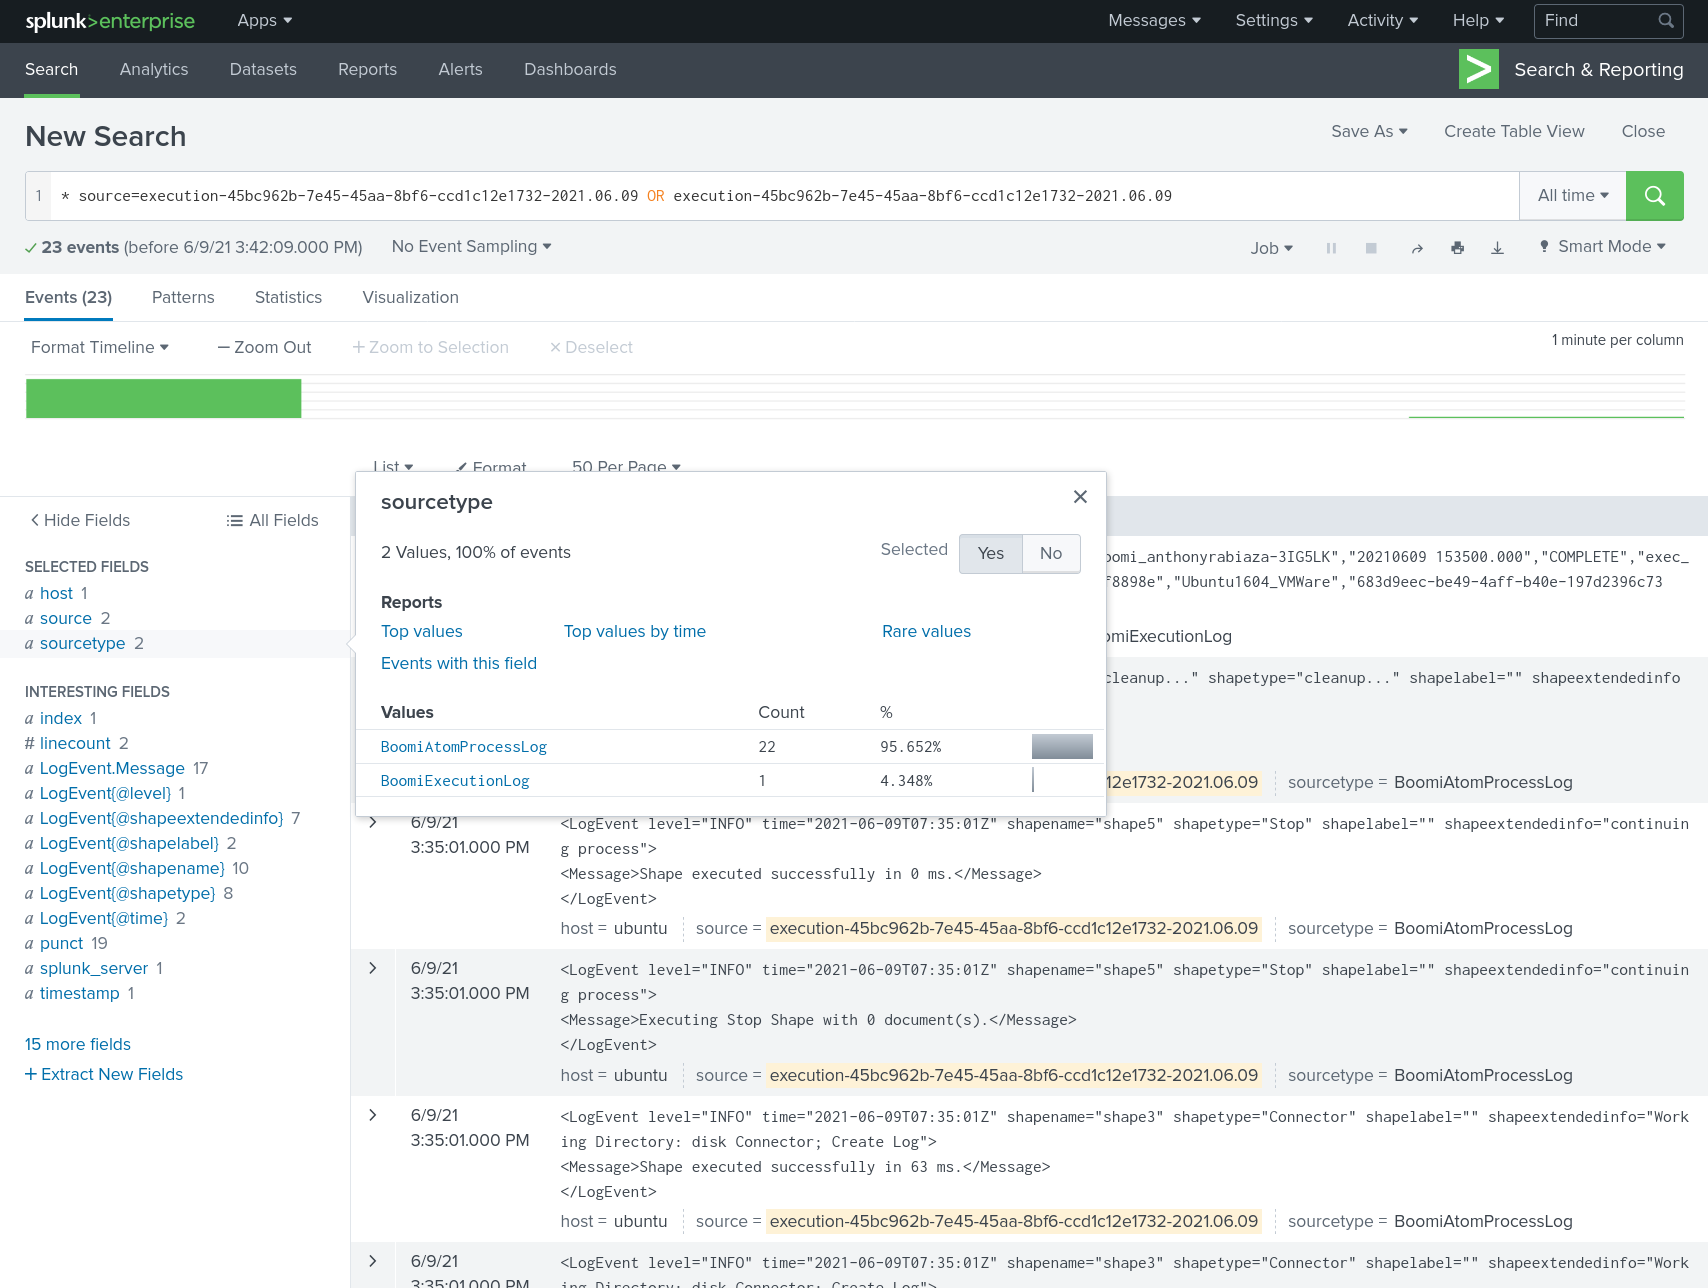
Clicking on a give execution will give you all the related logs (WSS, Process Logs, etc.)
Audit Logs
