Boomi Observability with AppDynamics
Implementation with a Monitoring Platform for Observability with AppDynamics
Overview
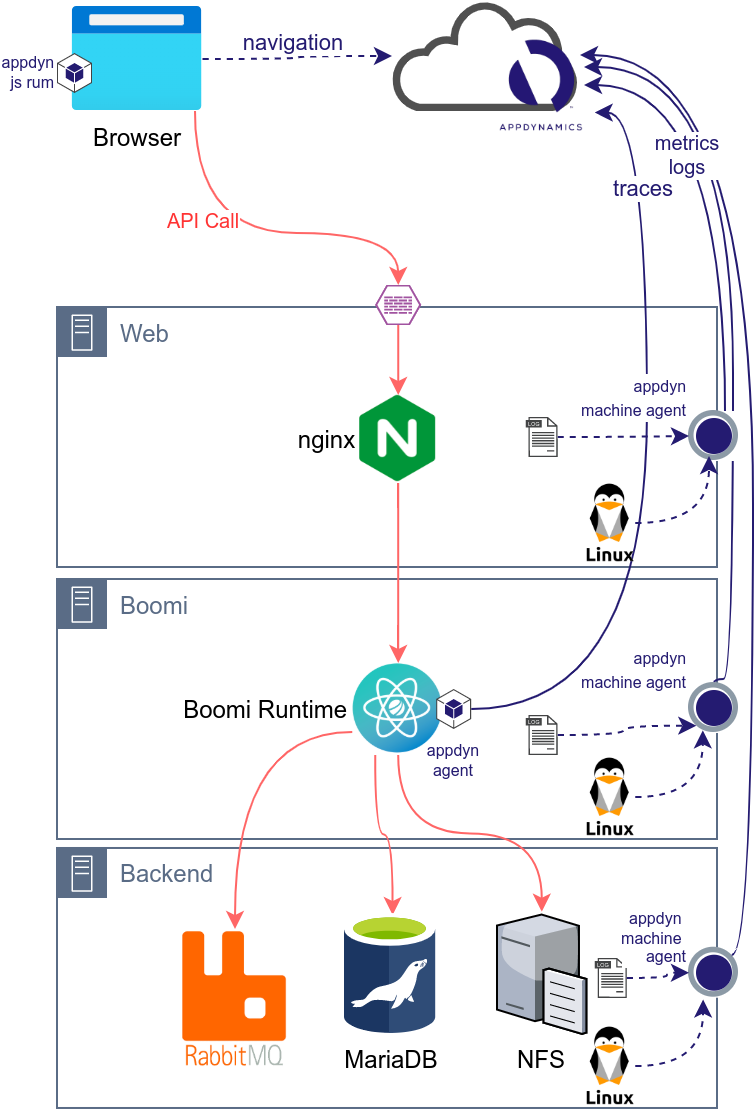
Machine Agent Installation
The first step consist of installing the AppDynamics Agent on each server. This step will link the server (or Cloud resource) to AppDynamics and will allows the gathering of metrics, status of server, processes, network, etc.
Java Agent Installation
The second step consist of installing the AppDynamics Java Agent on each Boomi runtime. This step will link the Java server to AppDynamics and will allows the gathering of JVM metrics and traces.
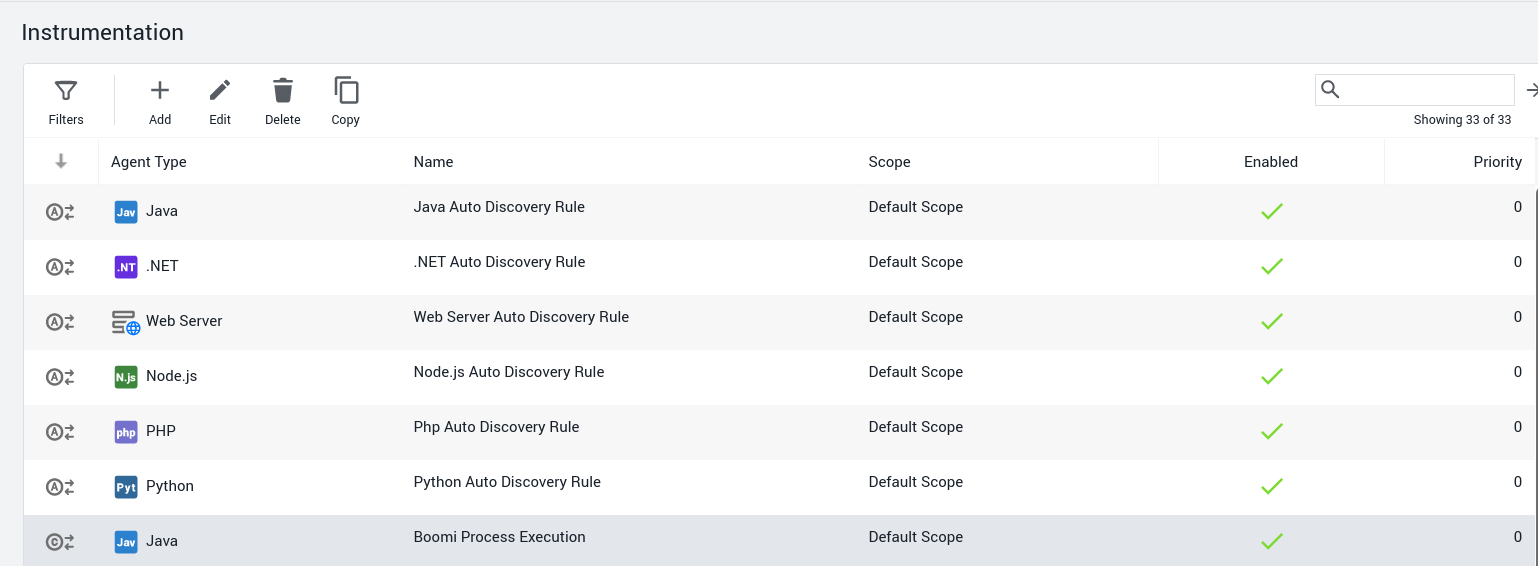
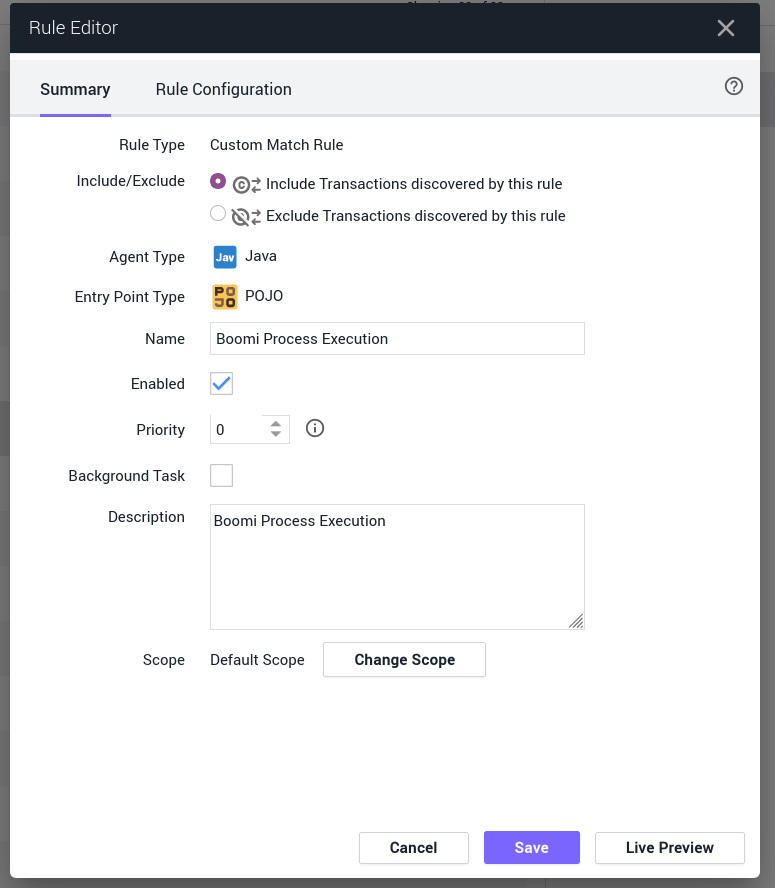
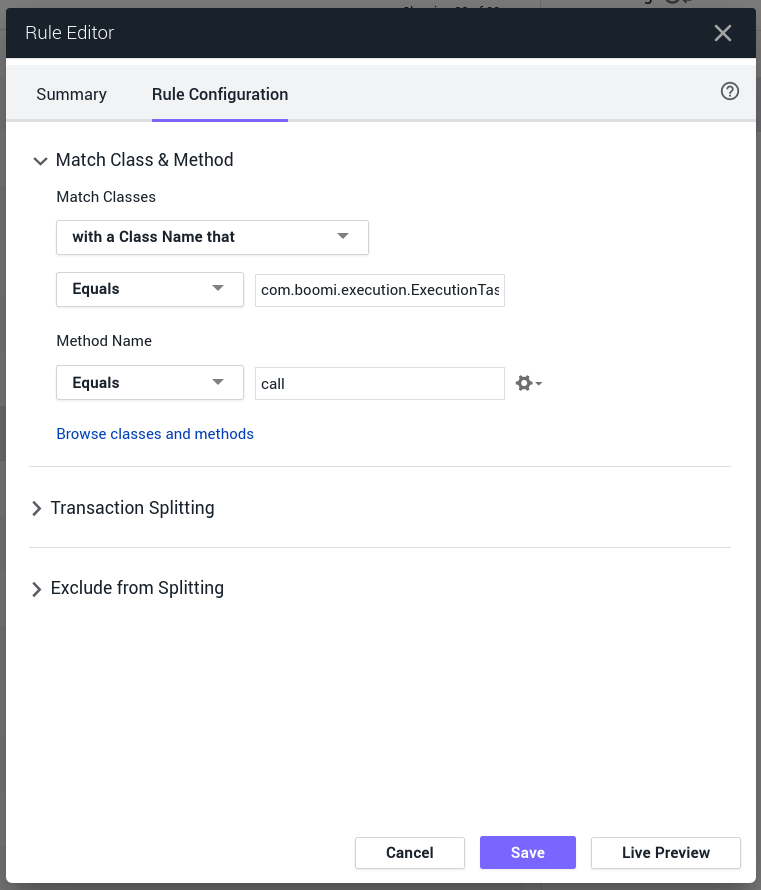
Transaction Detection
This part is optional and will allow the detection of all process executions in Boomi. If you are using the Boomi APM Connector or only monitoring APIs and JMS Processes, you can skip this part.
Backend Detection
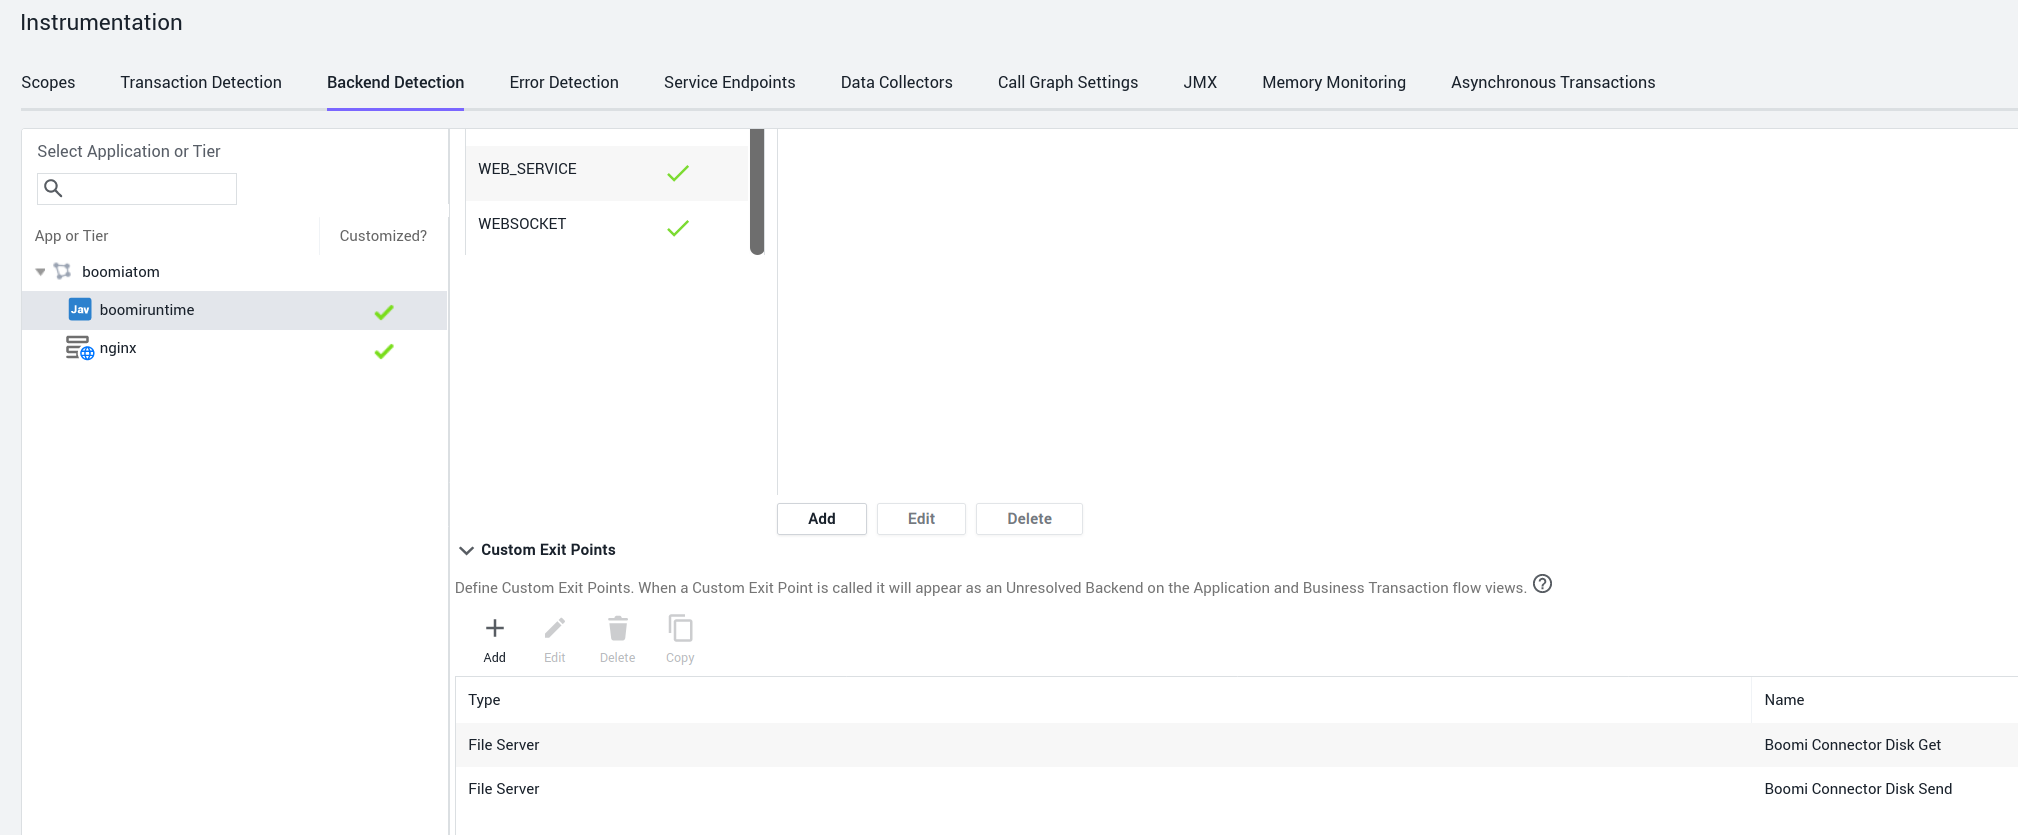
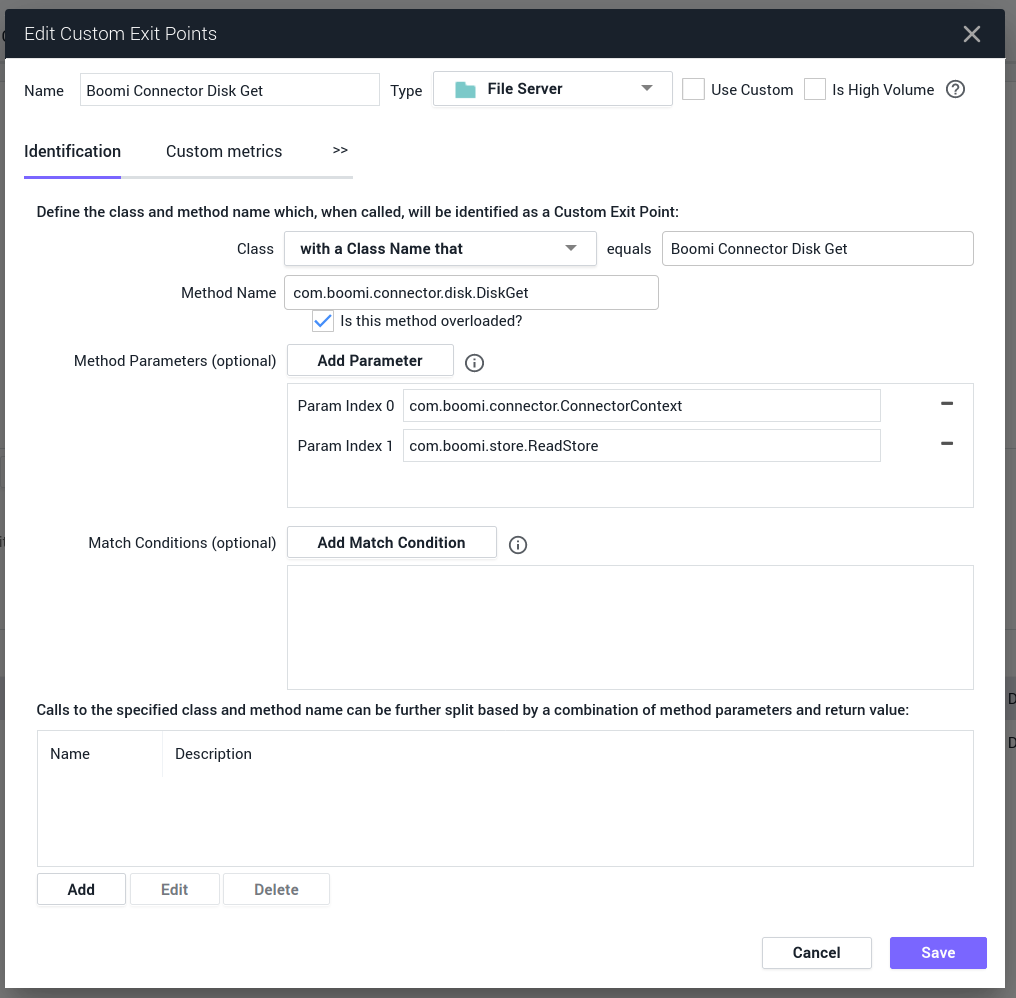
APM Setup
The AppDynamics Java Agent (Jar) needs to be deployed on each node or deployed on the Shared Server accessible by all nodes, once this is done Boomi System properties needs to be updated via Boomi AtomSphere:
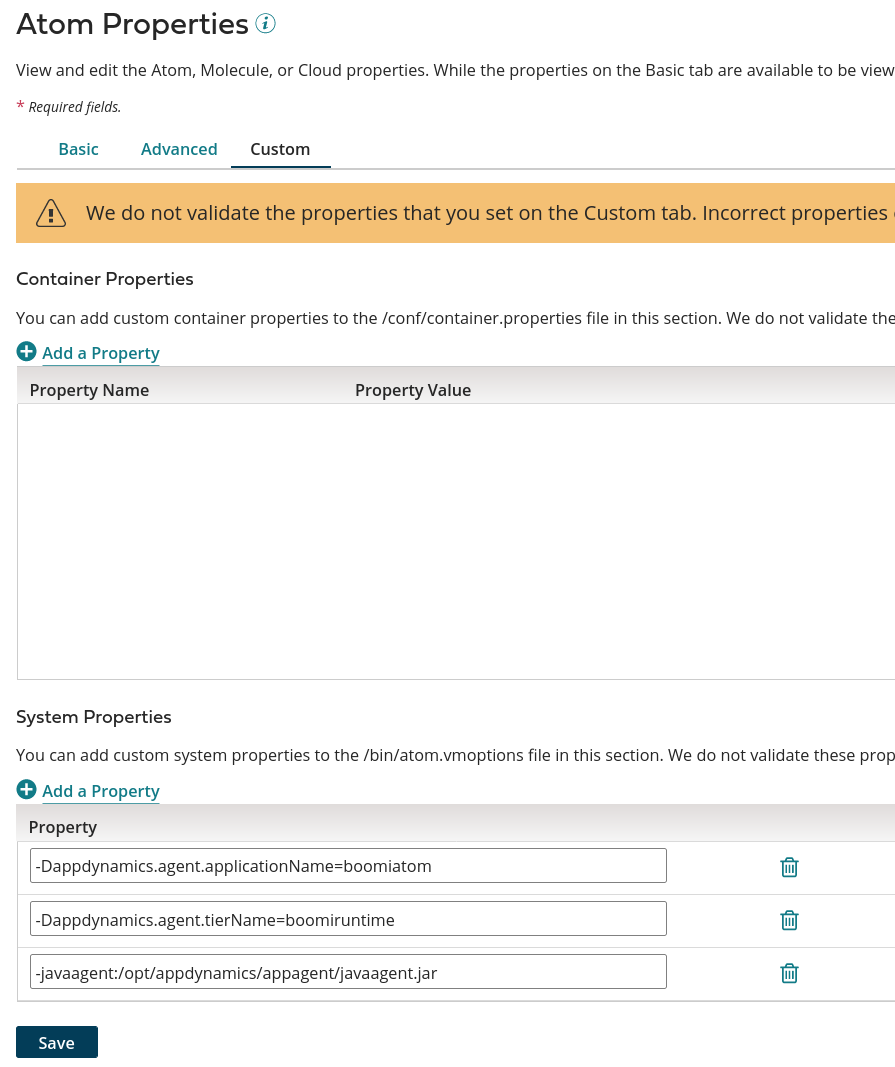
All the other configuration elements like controller-host, controller-port, account-name and account-key should remain in the controller-info.xml
Example of controller-info.xml
<?xml version="1.0" encoding="UTF-8"?>
<controller-info>
...
    <controller-host>bear2021XYZXYZ.saas.appdynamics.com</controller-host>
    <controller-port>443</controller-port>
    <controller-ssl-enabled>true</controller-ssl-enabled>
    <use-simple-hostname>false</use-simple-hostname>
    <application-name></application-name>
    <tier-name></tier-name>
    <node-name></node-name>
...
    <!-- Location of the Machine Agent which can be installed on each node-->
    <agent-runtime-dir>/opt/appdynamics/machine-agent</agent-runtime-dir>

    <enable-orchestration>false</enable-orchestration>
...
    <account-name>bear2021XYZXYZ</account-name>
    <account-access-key>abcdefghijkl</account-access-key>
...
</controller-info>
APM Configuration: Tracing and Custom Data Collector
Boomi API Processes and Boomi JMS Processes
In the context of AppDynamics, the Boomi API processes do not require any change, they will be automatically detected by AppDynamics and instrumentation will be required only to get advanced metadata (see next section).
The operation name for instance /ws/rest/apm/test/MQ/ and the HTTP method will help us identifying the API process.
Boomi Custom Library
- For instrumentation, you need to download an archive from AppDynamics: for instance java-agent-api-20.6.0.30246.zip
- Unzip the package
- Rename agent-api.jar to appdynamics-agent-api.jar
- Upload the Jar to Boomi>Settings>Account Libraries
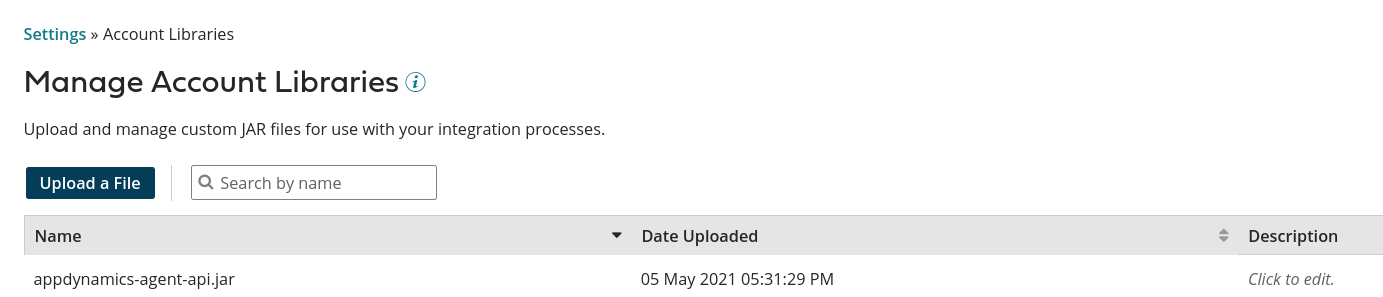
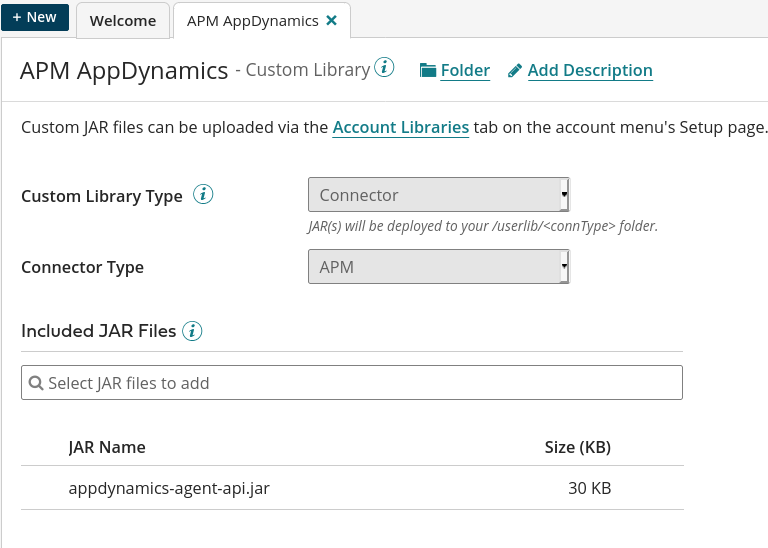
- Create a Custom Library and Deploy it to the Environment which will be monitored by AppDynamics
Boomi Scheduled Processes
The Boomi Scheduled processes will also be detected by AppDynamics due to the configuration in Boomi AtomSphere.
But the name of the process and other details won’t be available. An manual instrumentation of the process will be required to get this details: the use of Boomi APM Connector will minimize the changes:
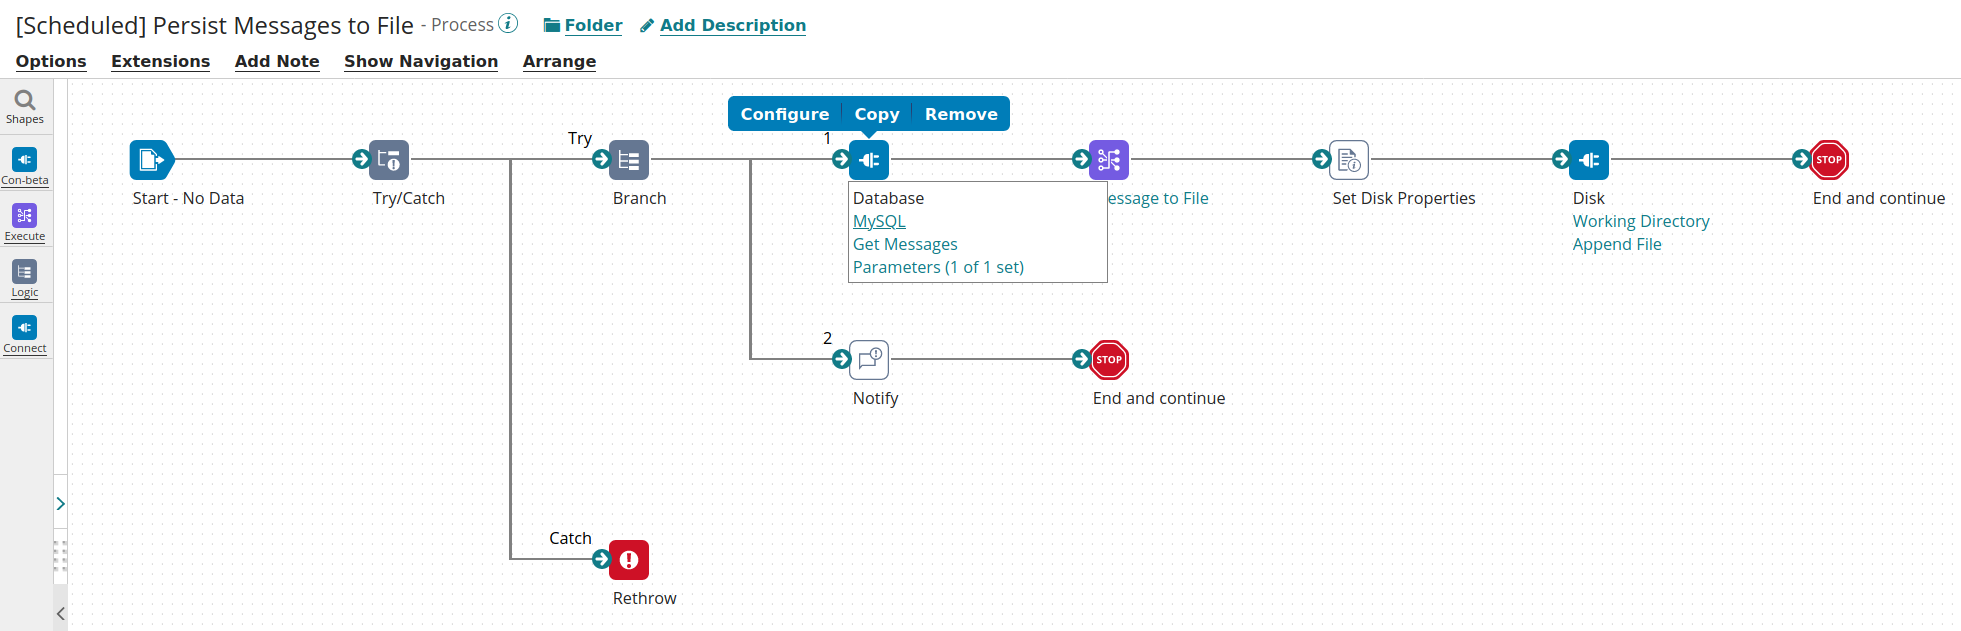
Initial process:
The updated process will looks like the following:
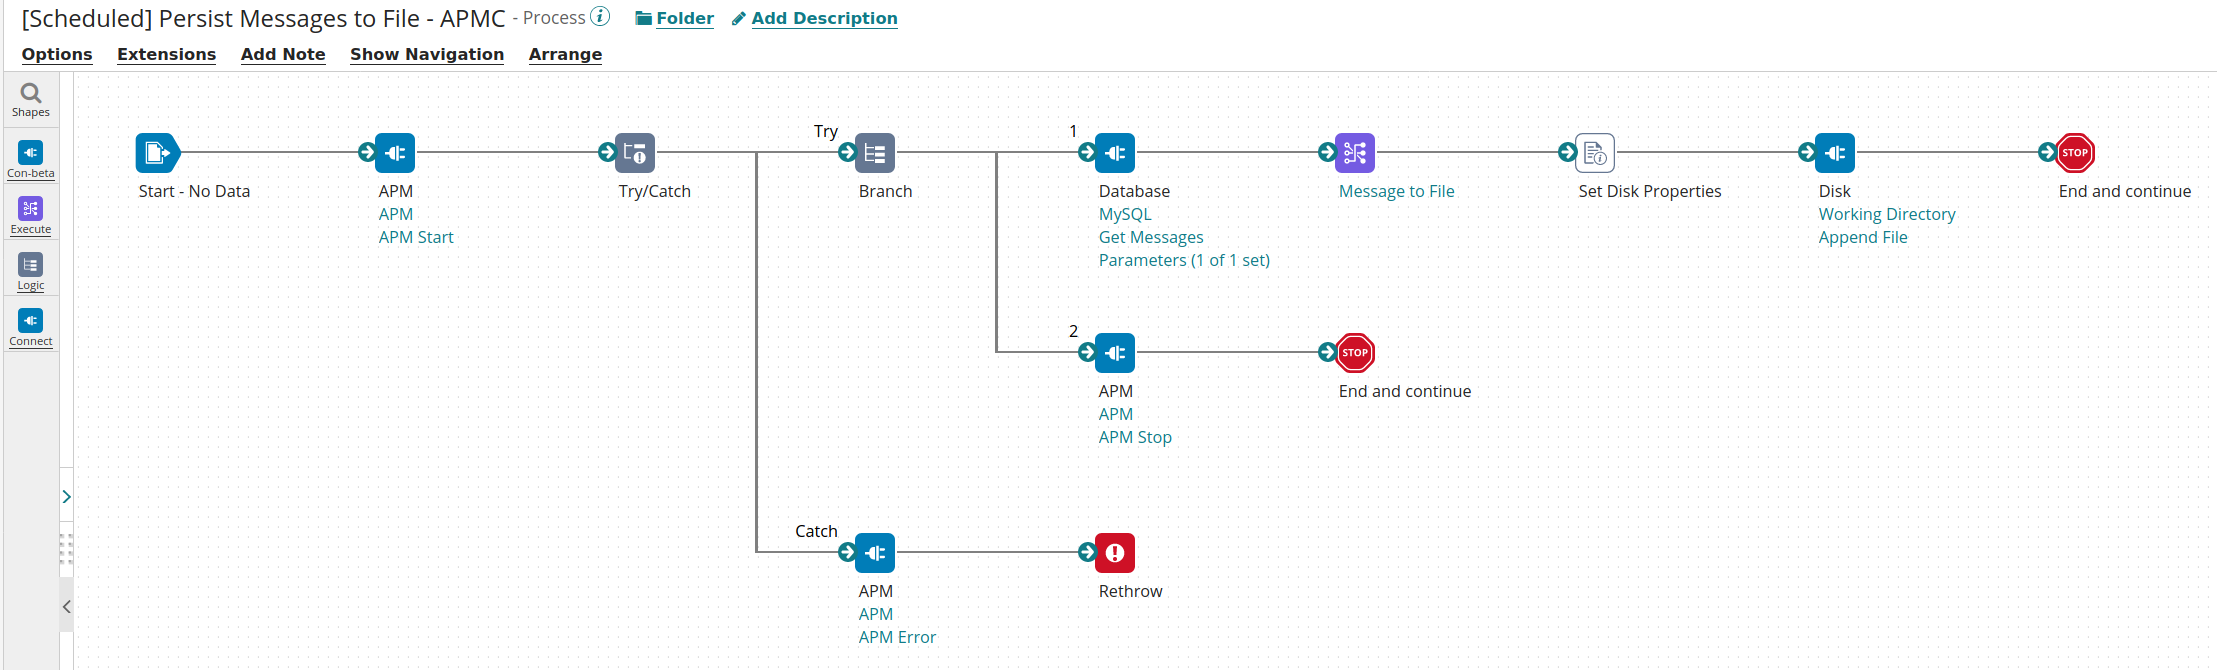
The changes includes:
- The APM Start shape at the beginning
- The APM Stop shape before the last End, please note that we created a branch here as the Disk shape (Get) might not returned a Document thus an APM Stop shape after the Disk might not be called
- The APM Error in the try catch
The Boomi APM Connector will allow the Instrumentation of any Boomi Processes and will provide:
- Tracing: 3 steps: Start, Stop or Error
- Eventing, in Stop or Error steps and event can be sent to AppDynamics to inform of the success or failure of the process (including all details: server, time, environment, execution context…)
- Custom Metrics: a Boomi Process can send metrics related to business data or systems to AppDynamics
Review of the Observability with AppDynamics
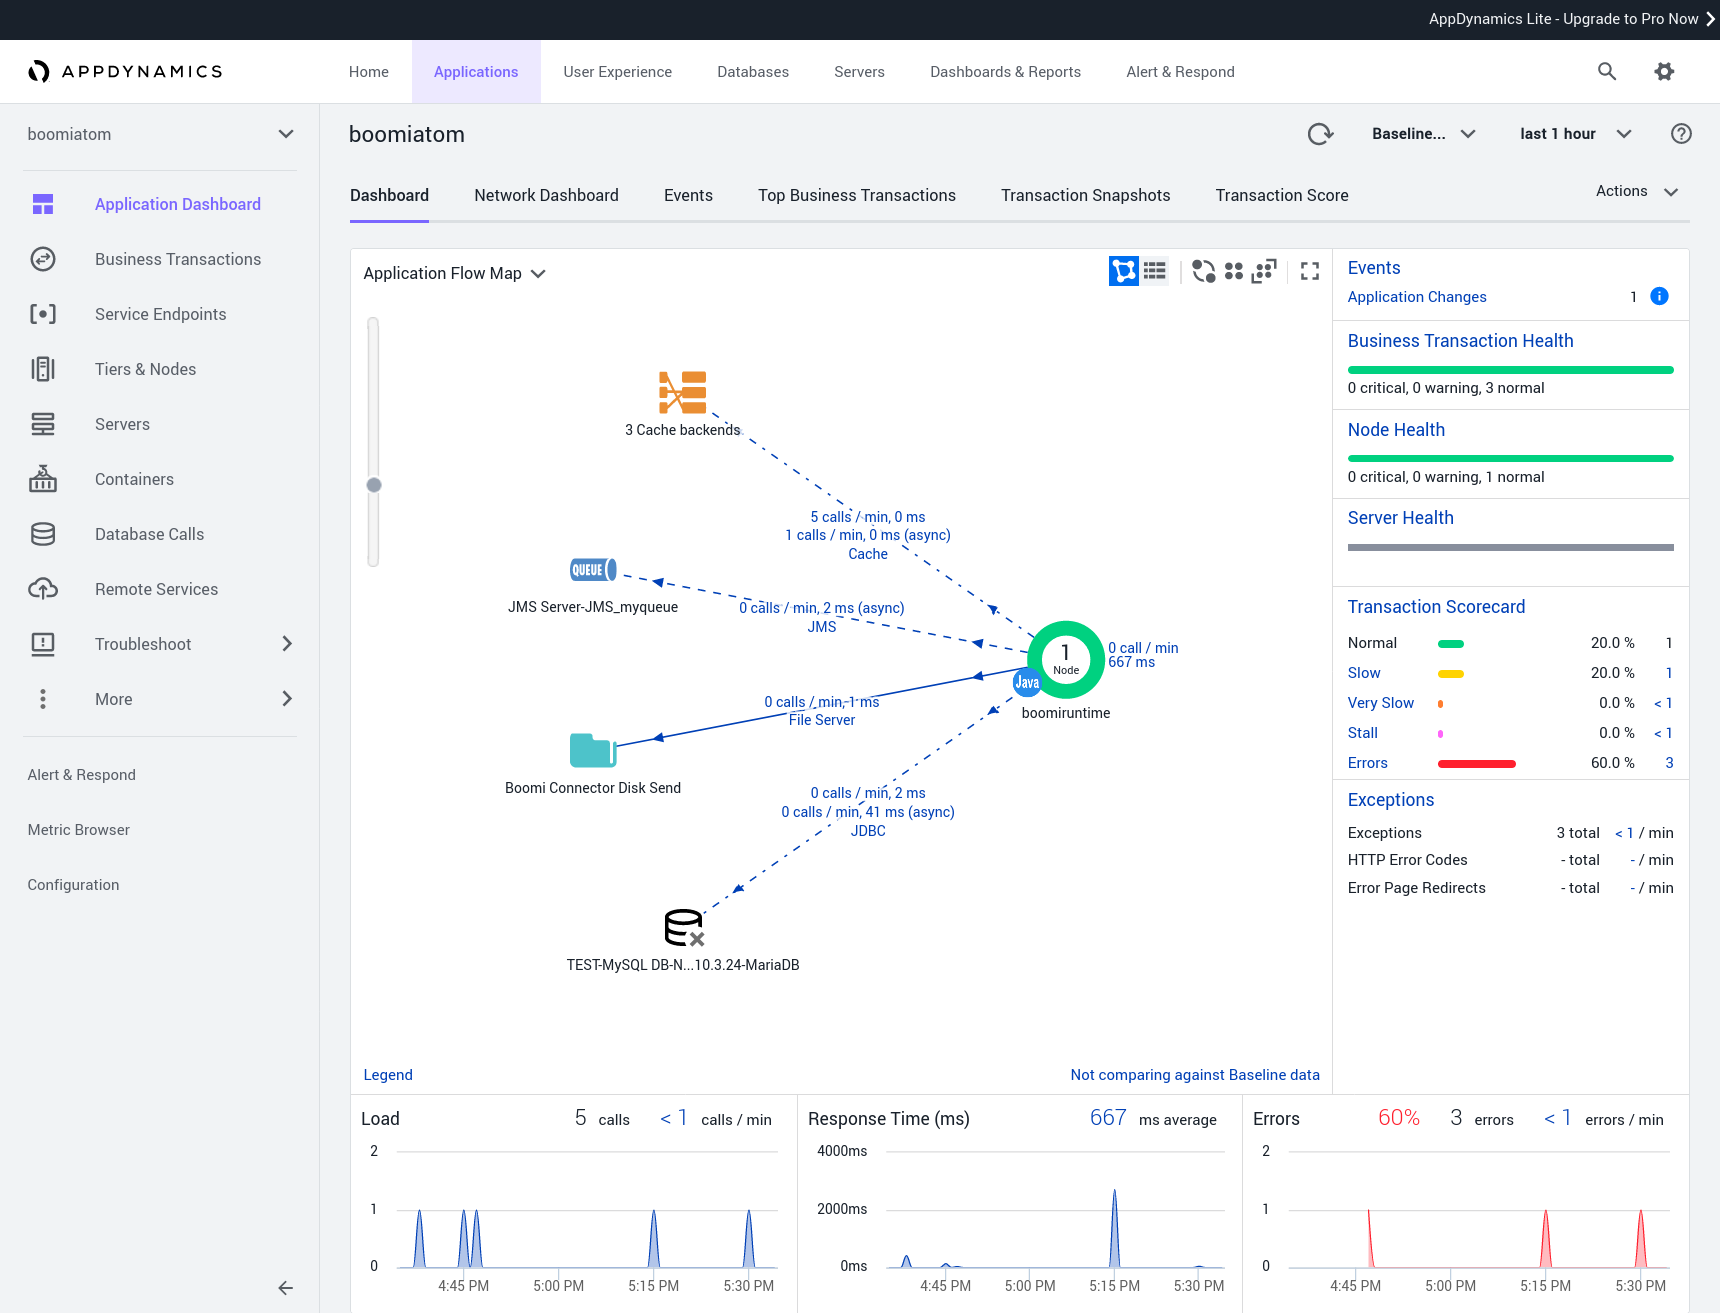
View of Dashboard
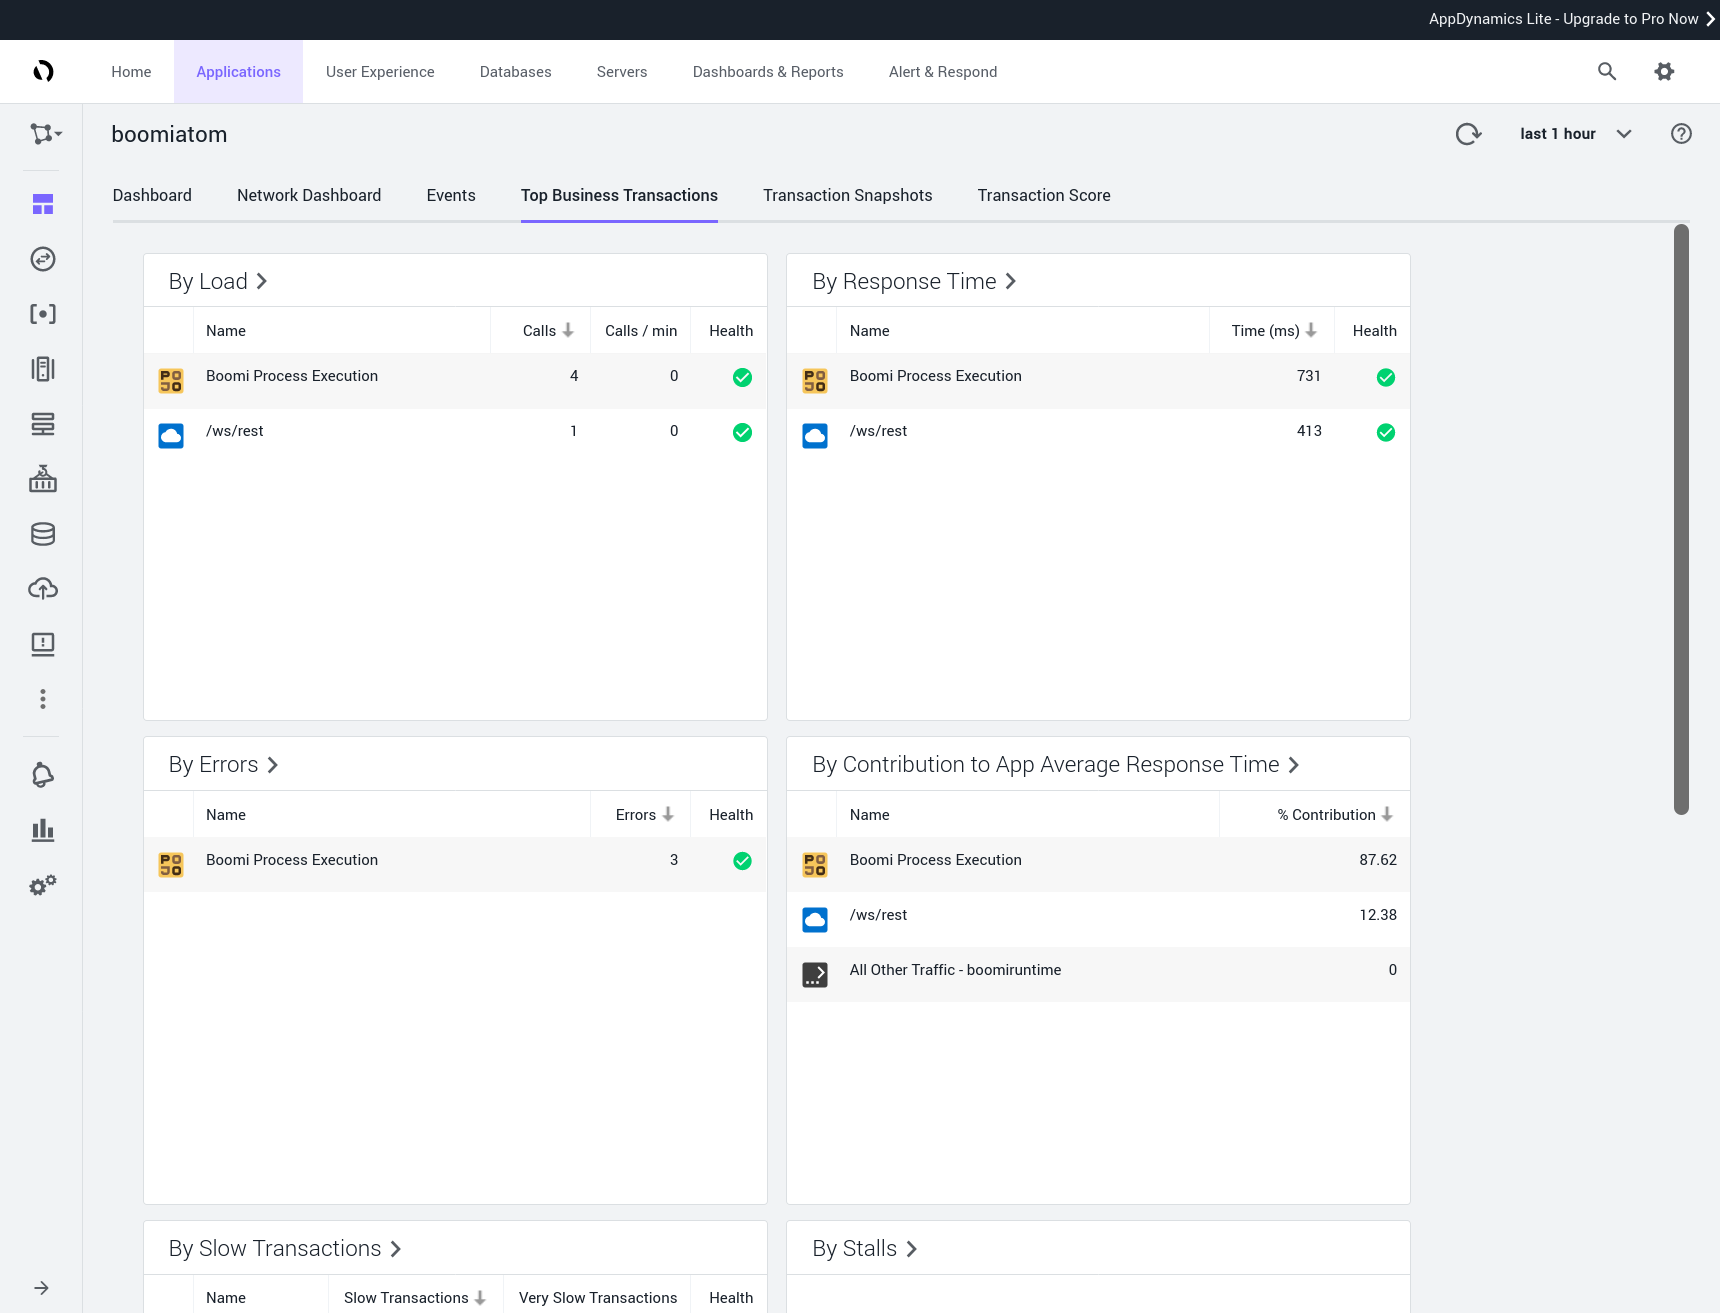
Top Business Transactions
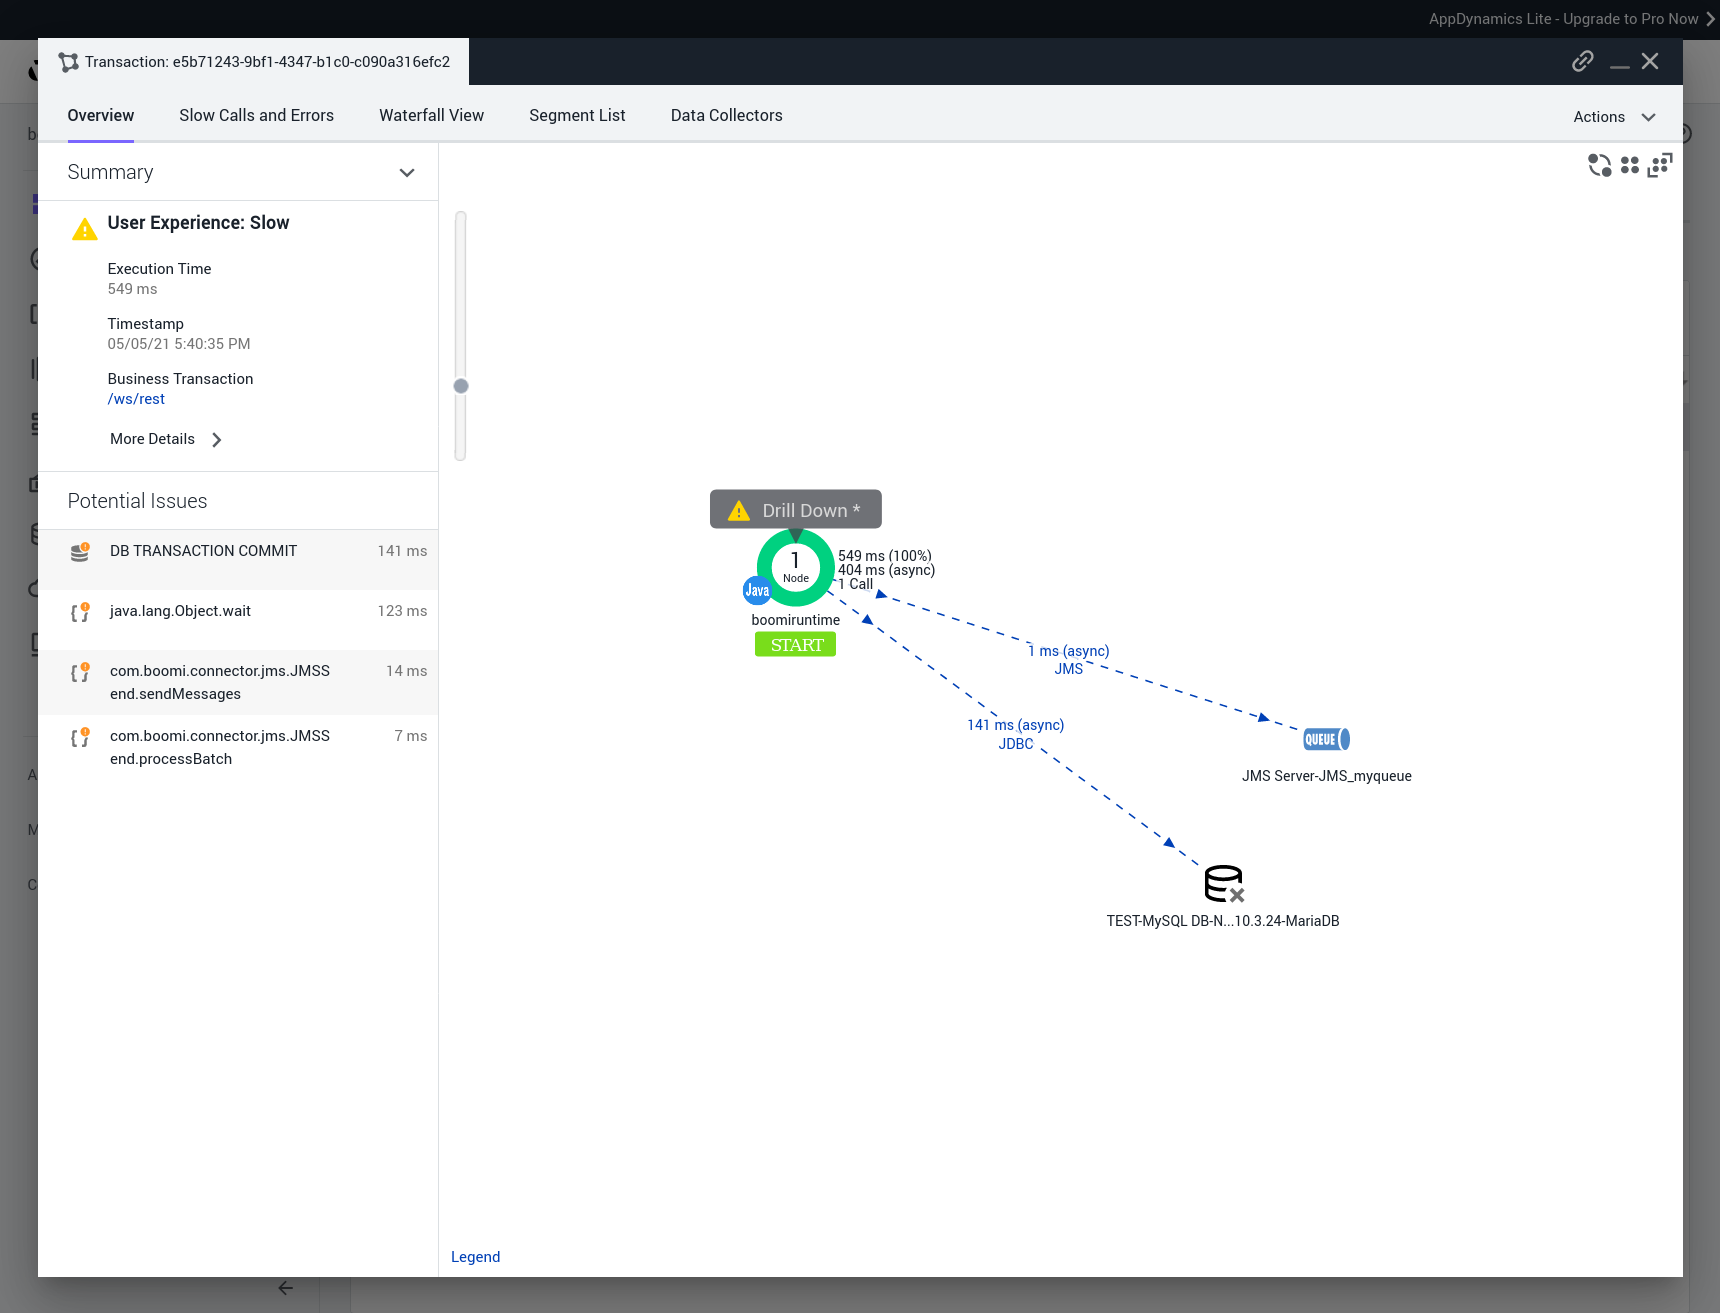
Details of API Call to all back-end systems
We have an end-to-end view of the API Call:
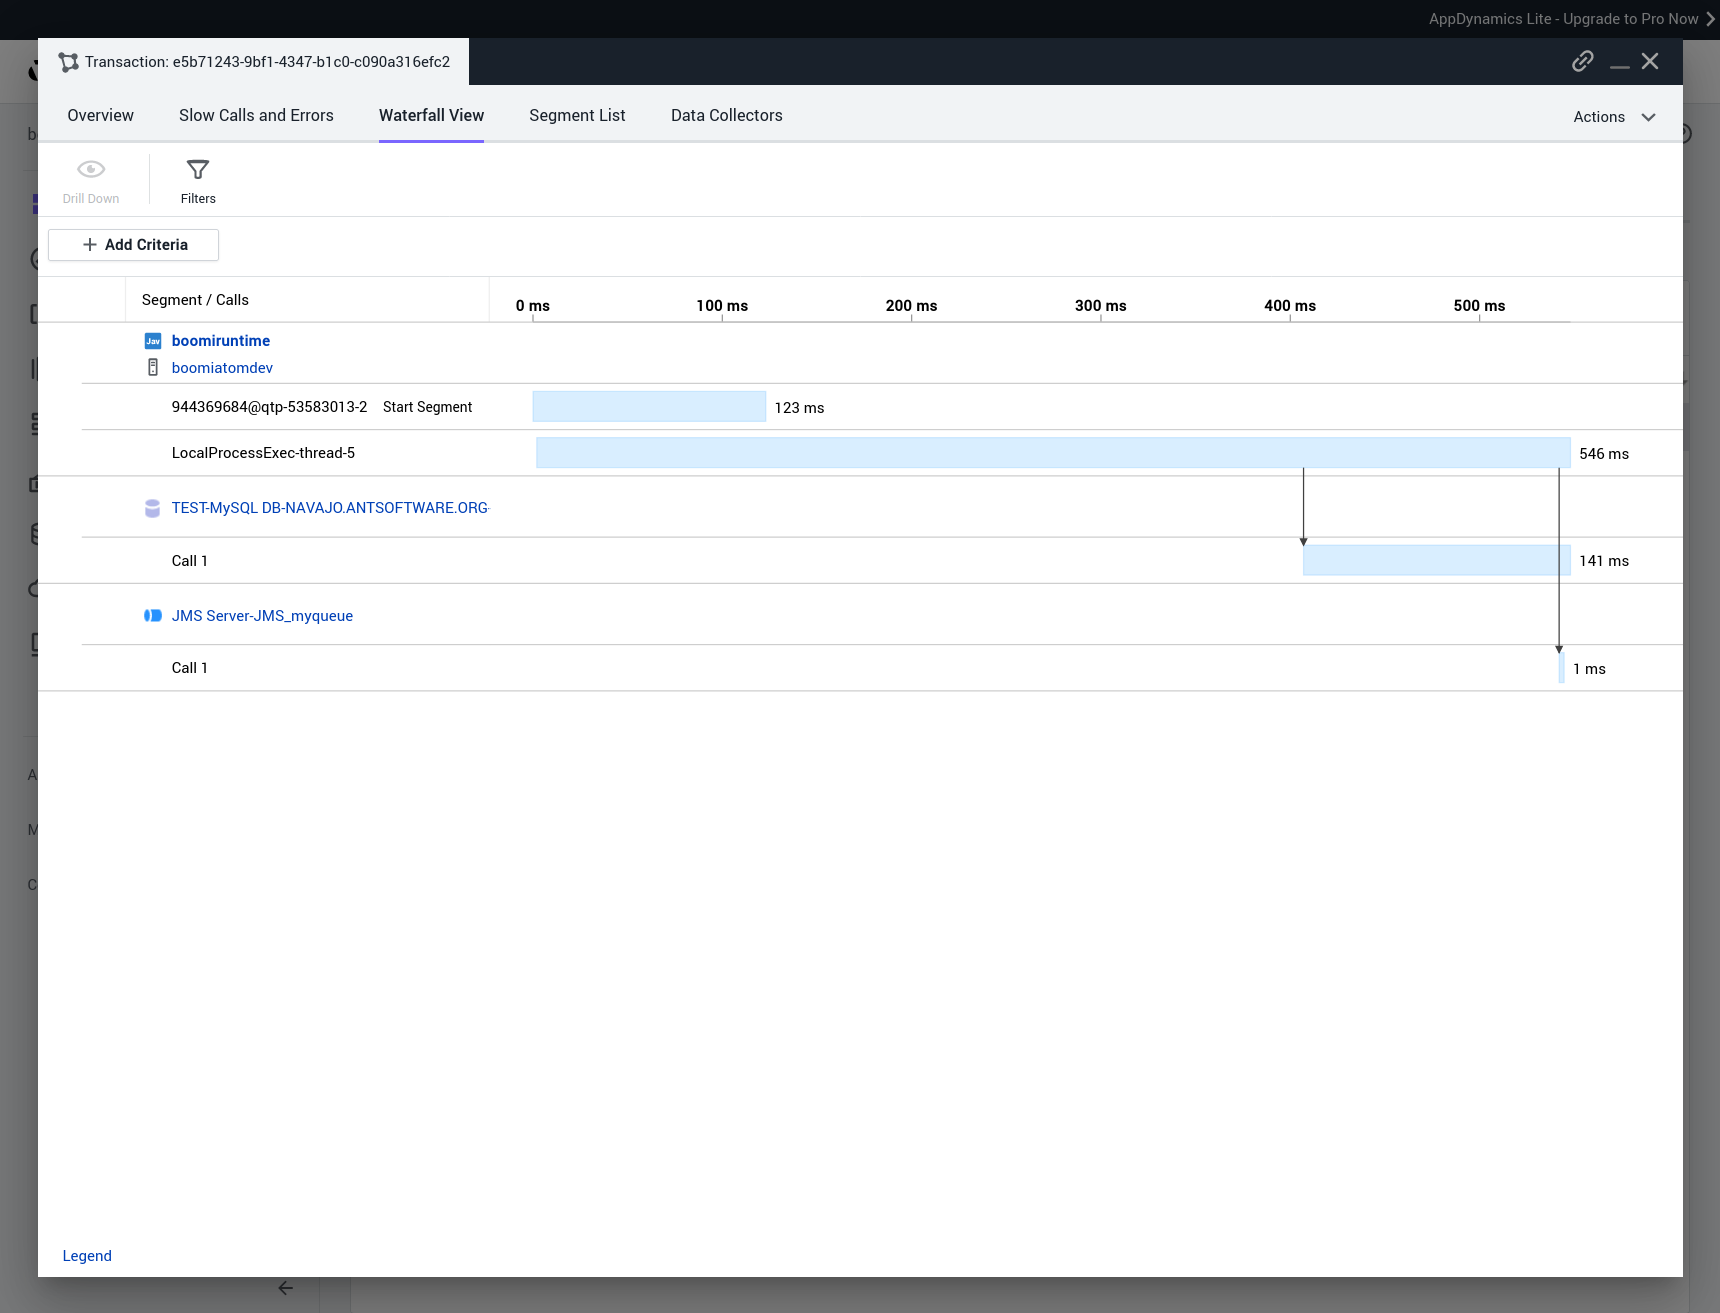
Waterfall view:
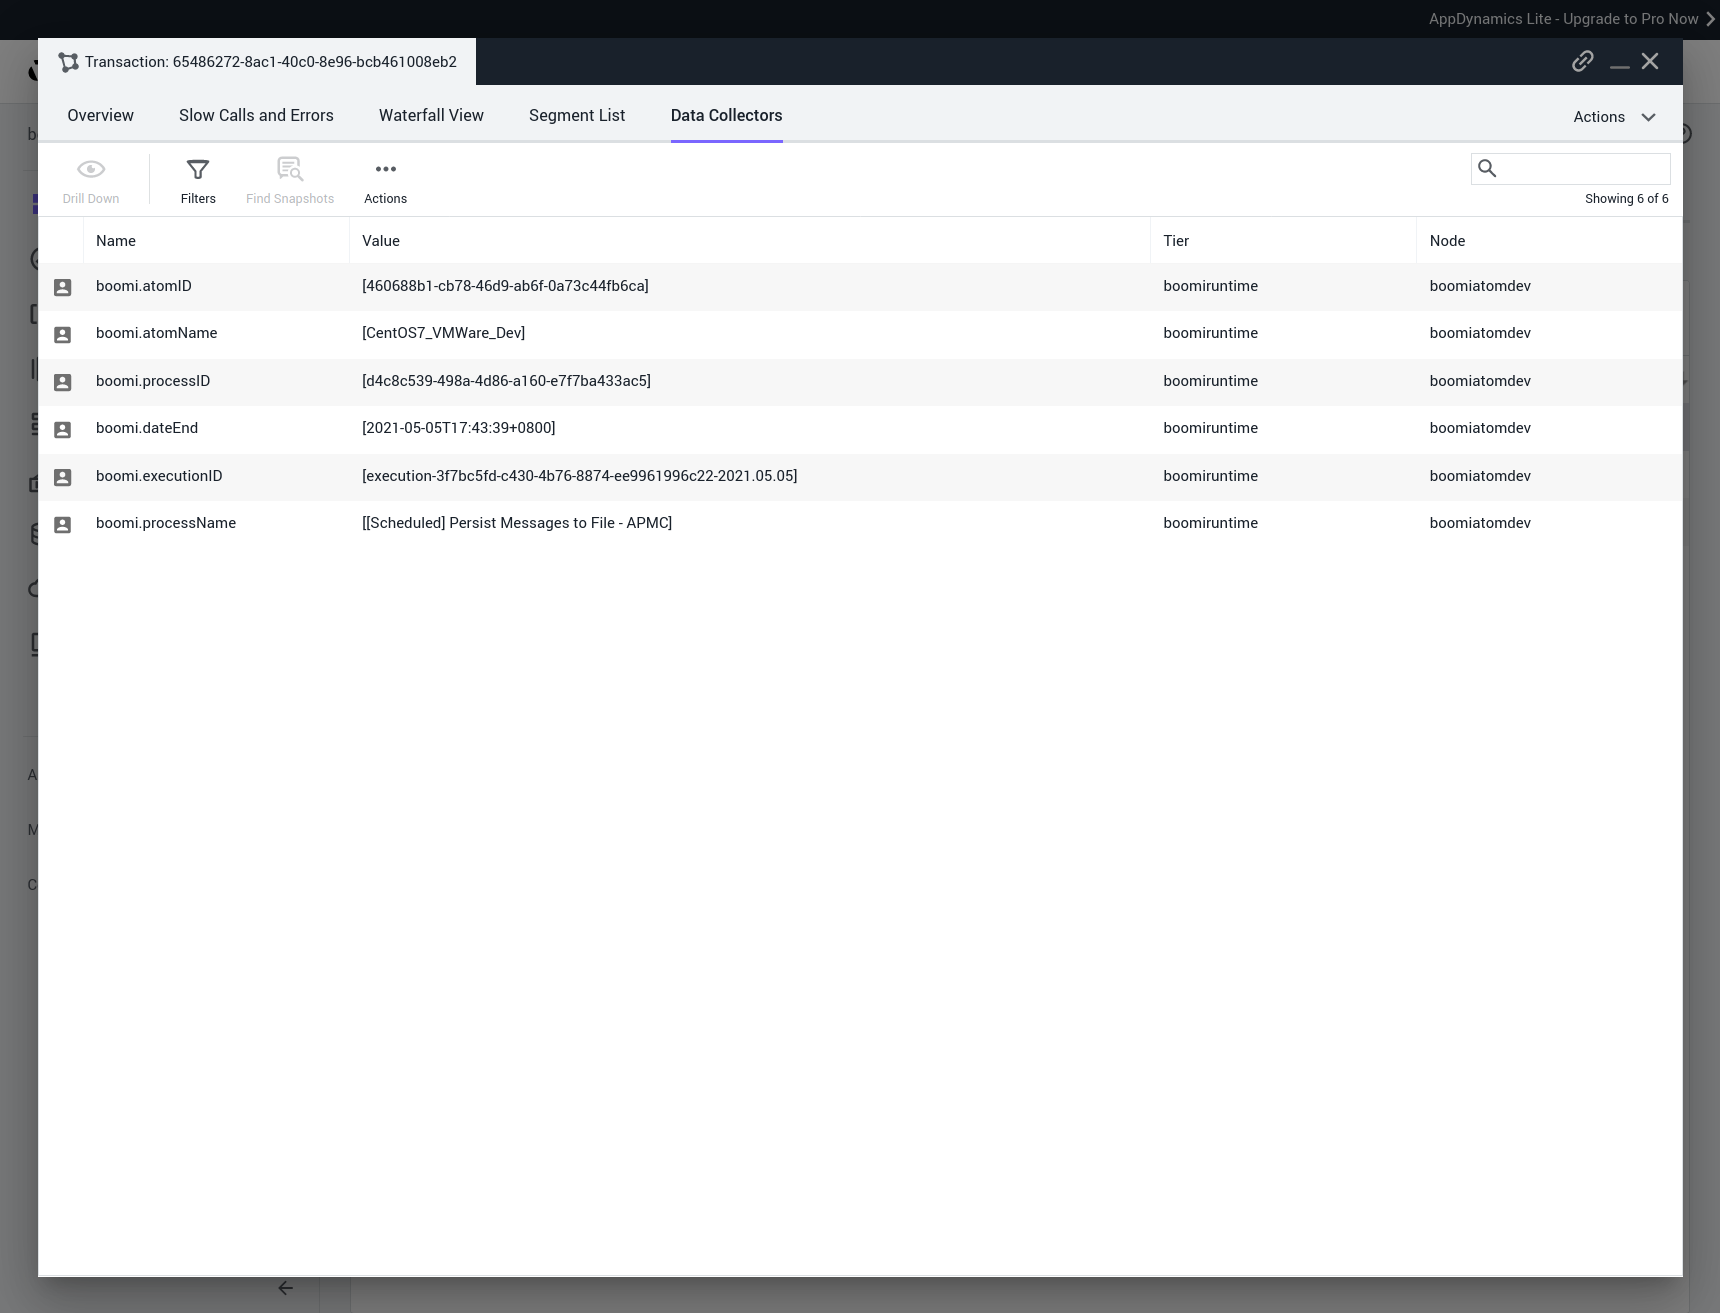
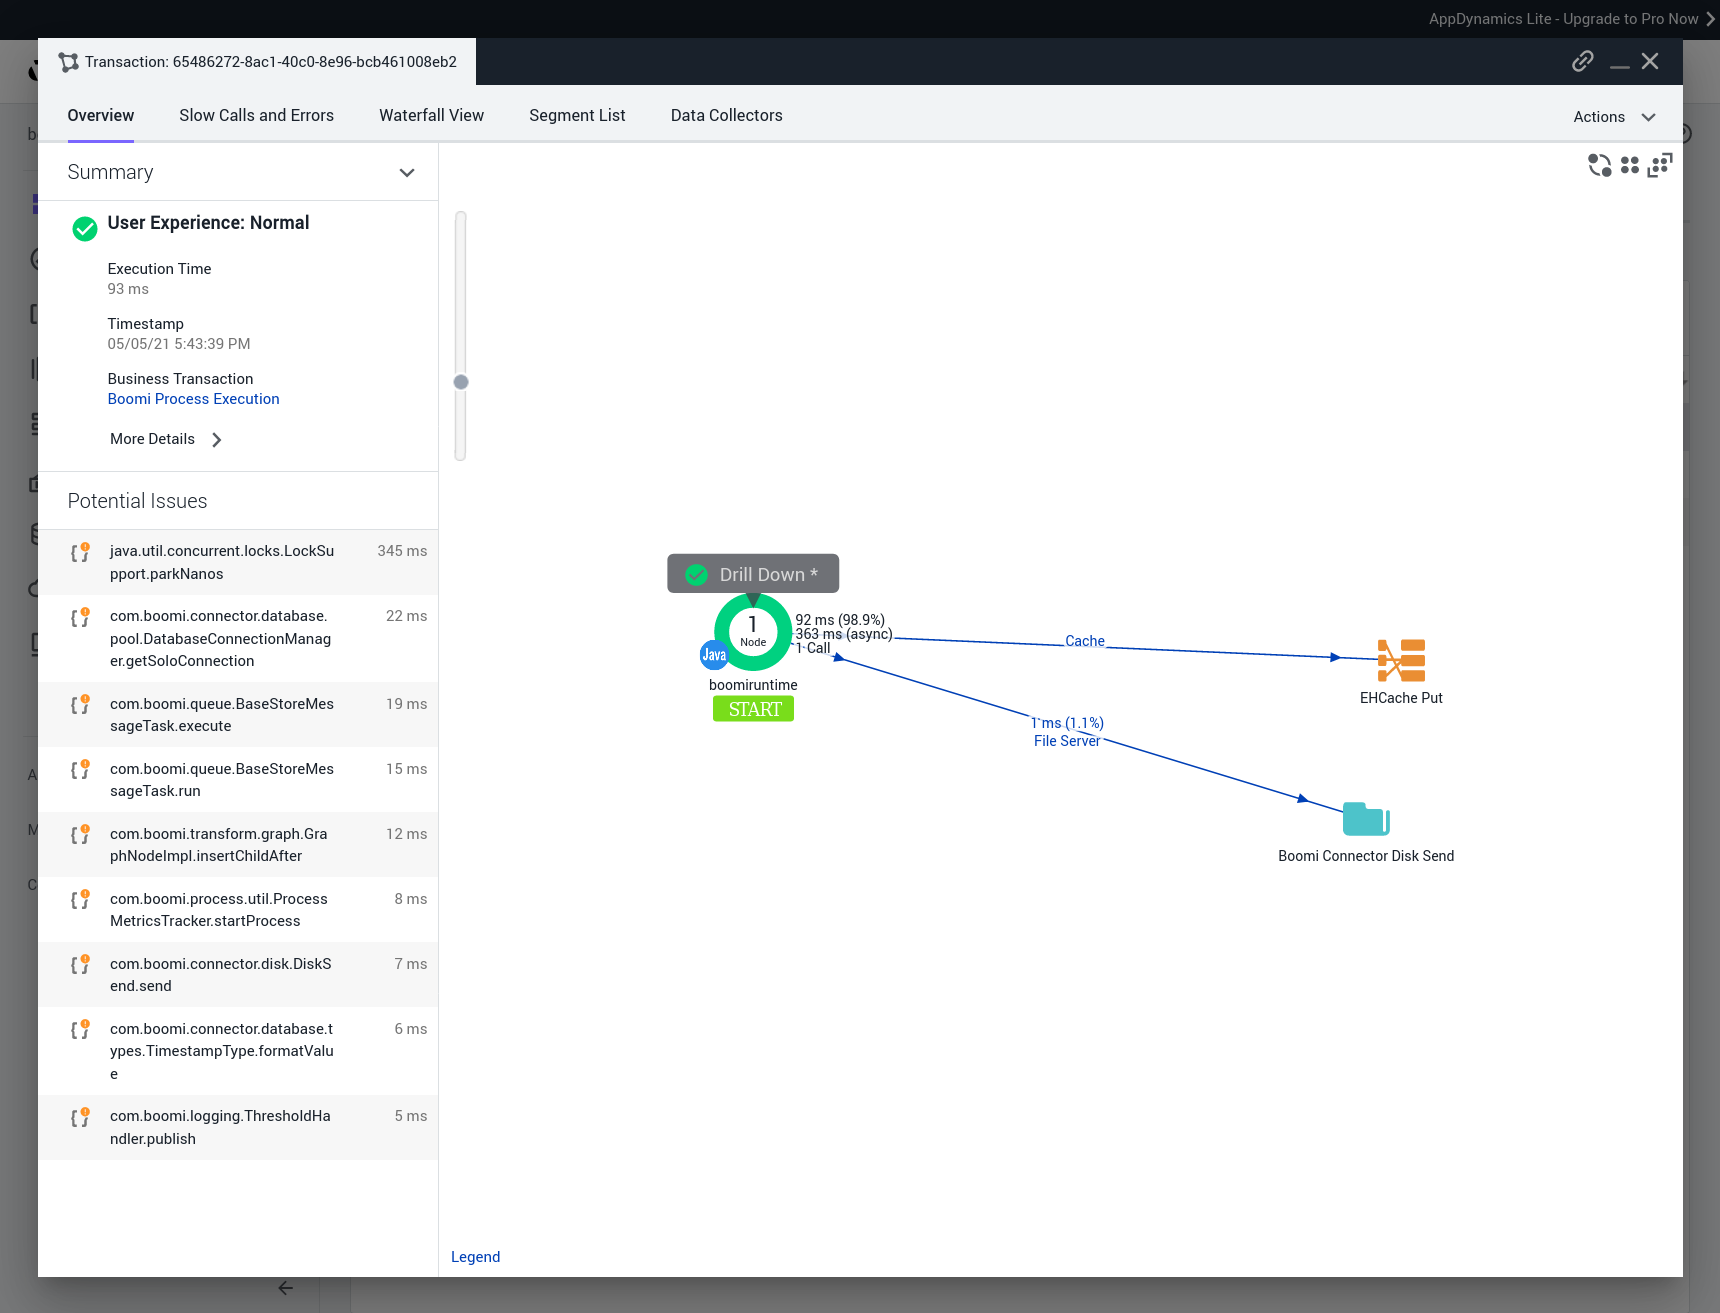
Detail of Scheduled Processes
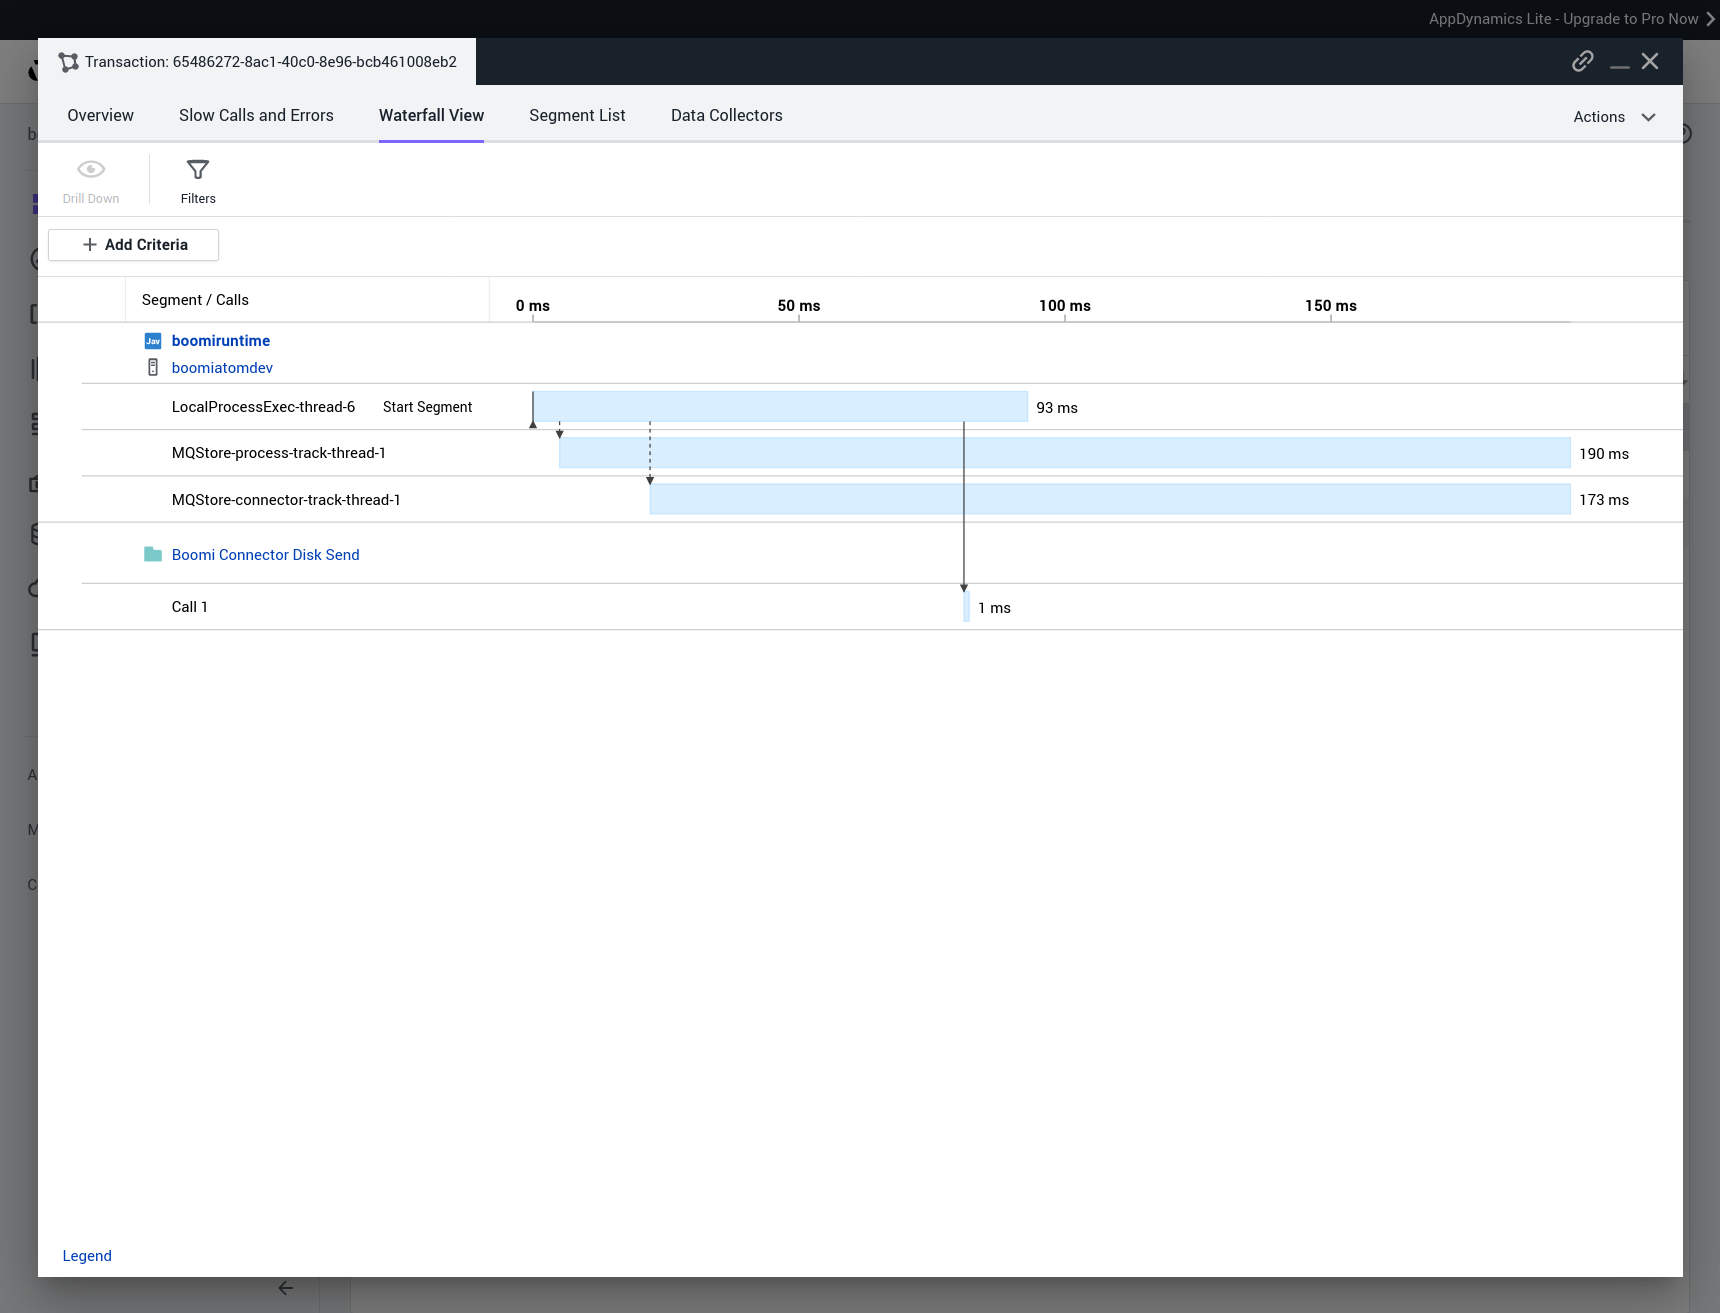
We have an end-to-end view of the Process:
Waterfall view:
Metadata (added by the APM Connector):