Boomi Observability with AWS CloudWatch and X-Ray
Implementation with a Monitoring Platform for Observability with AWS CloudWatch and X-Ray
Overview
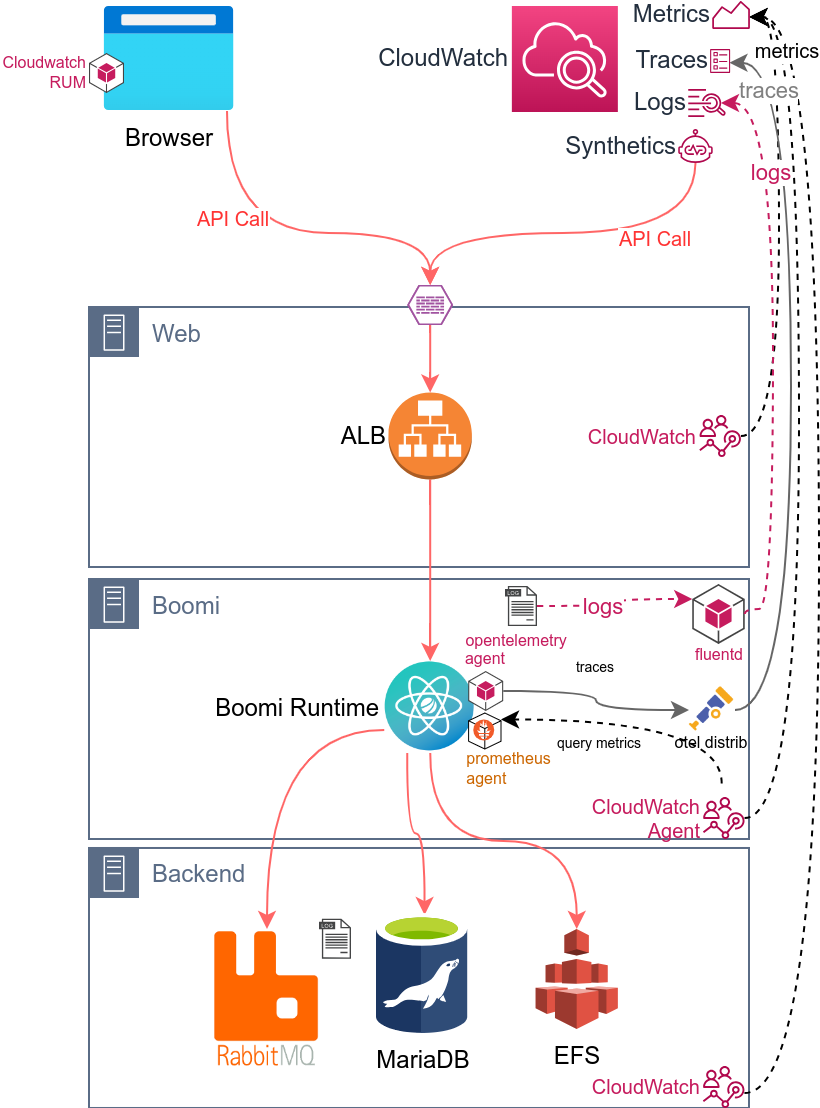
CloudWatch Stack Installation
The first step consist of installing the CloudWatch elements on each server:
- CloudWatch Agent (see installation steps)
- Fluent-D with CloudWatch plugin (see installation steps and sample configuration)
- AWS Distro for OpenTelemetry Collector for CloudWatch (see installation steps with a sample configuration)
- Prometheus Exporter (see installation steps)
This step will link the server to CloudWatch and will allows the gathering of logs, metrics, status of server, processes, network, etc.
Java Agent Installation
The second step consist of installing the Java Agent on each Boomi runtime. This step will link the Java server to the OpenTelemetry Collector and will allows the gathering of JVM metrics and sending of traces.
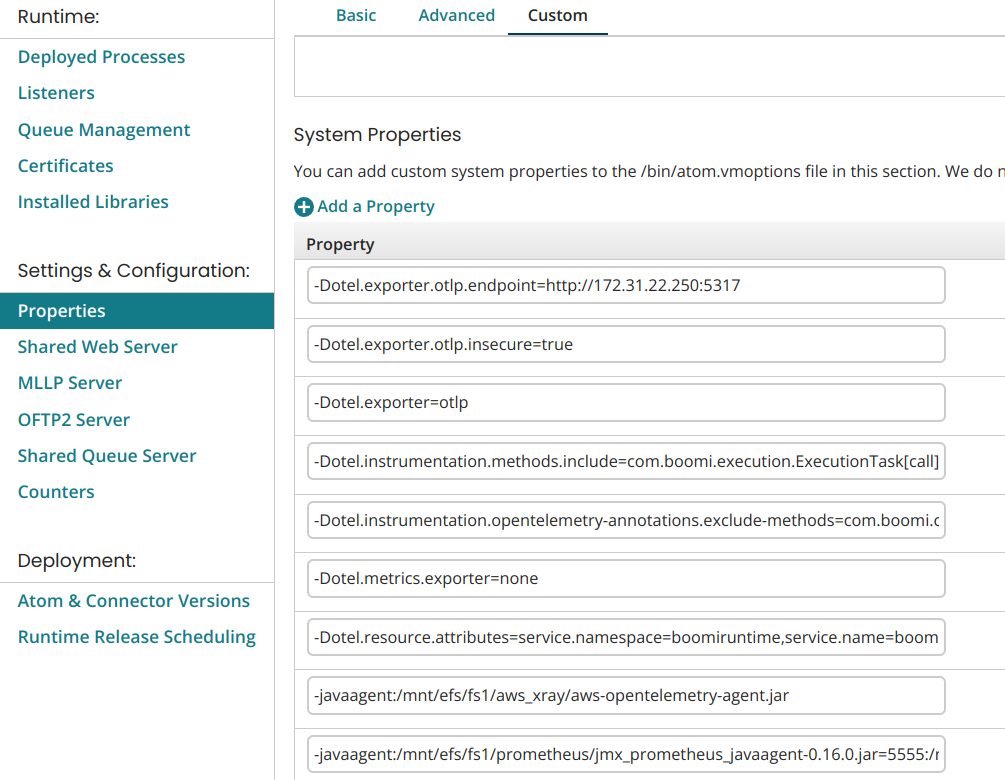
APM Setup
The X-Ray Java Agent (Jar) needs to be deployed on each node or deployed on the Shared Server accessible by all nodes. Once this is done, Boomi System properties needs to be updated via Boomi AtomSphere:
APM Configuration: Tracing
Boomi Scheduled Processes
The Boomi Scheduled processes will not be detected by X-Ray and requires a manual instrumentation using Boomi APM Connector to add the tracing metadata:
Initial process:
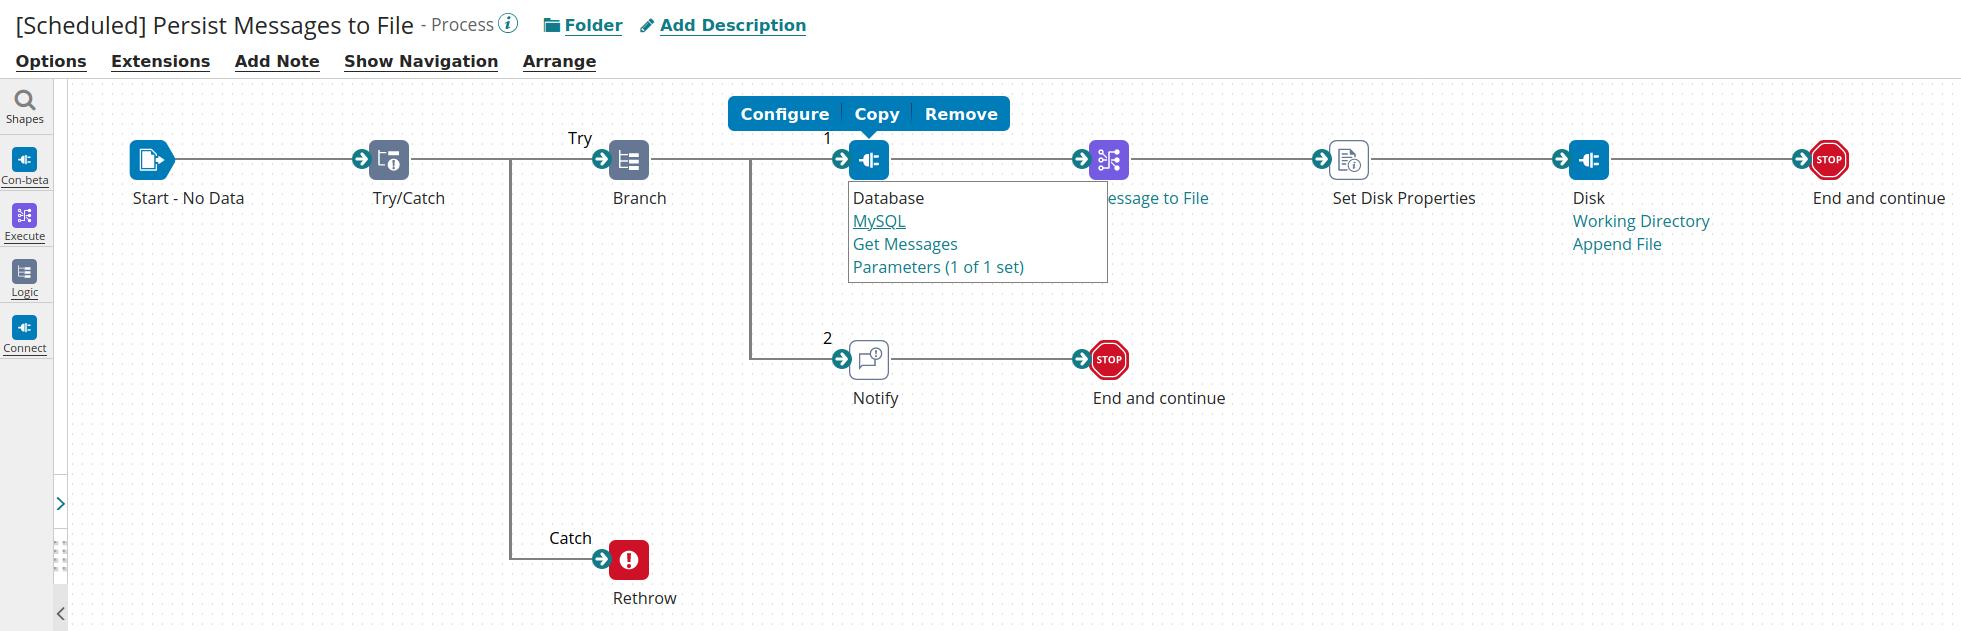
The updated process will looks like the following:
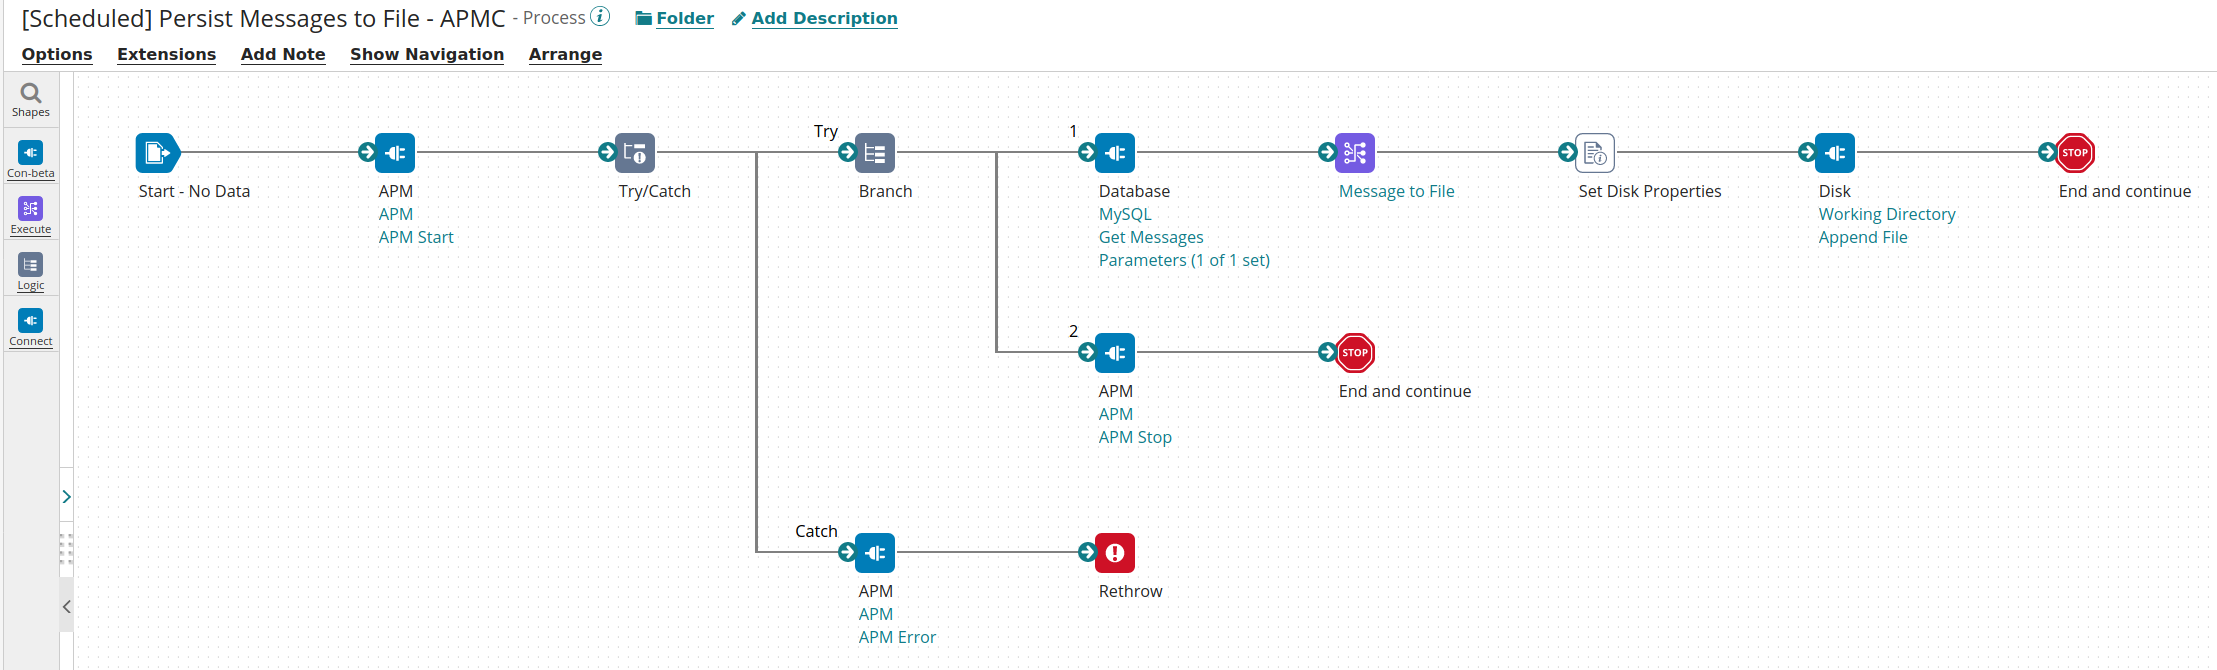
The changes includes:
- The APM Start shape at the beginning
- The APM Stop shape before the last End, please note that we created a branch here as the Disk shape (Get) might not returned a Document thus an APM Stop shape after the Disk might not be called
- The APM Error in the try catch
The Boomi APM Connector will allow the Instrumentation of any Boomi Processes and will provide tracing with 3 steps: Start, Stop or Error
Boomi API Processes
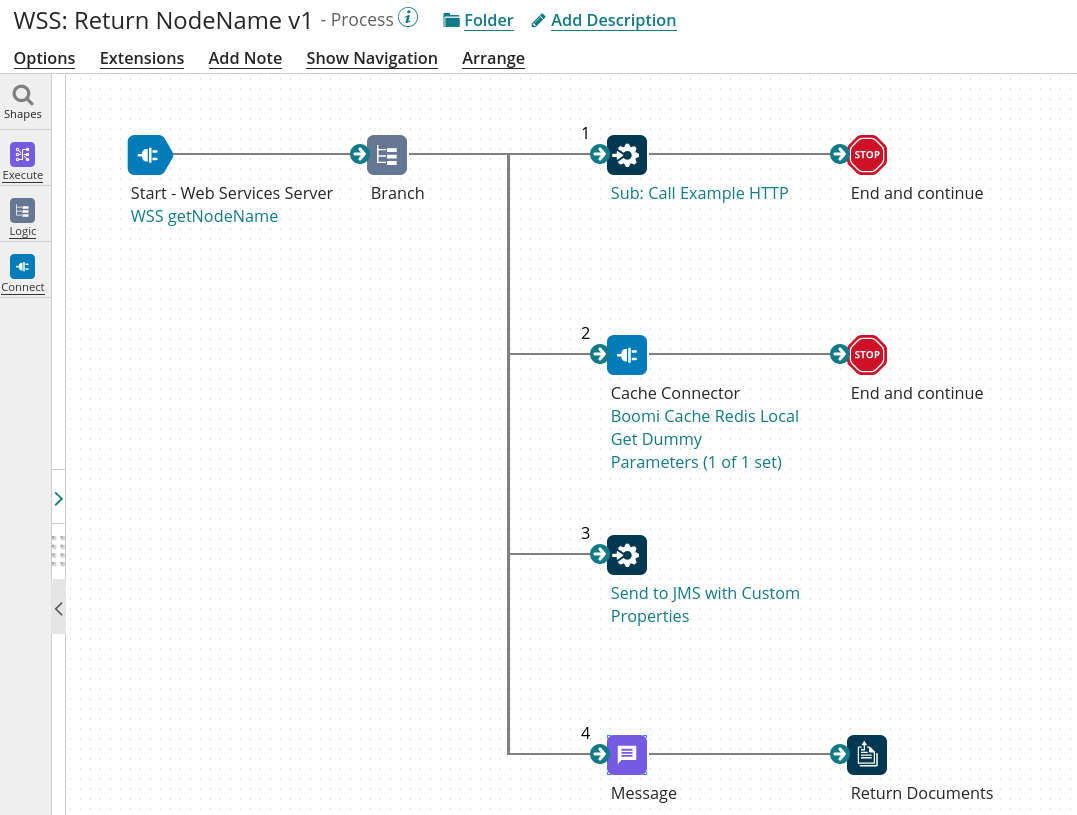
In the context of X-Ray, the Boomi API processes also require manual instrumentation using the Boomi APM Connector.
Boomi API before changes:
Boomi API after changes:
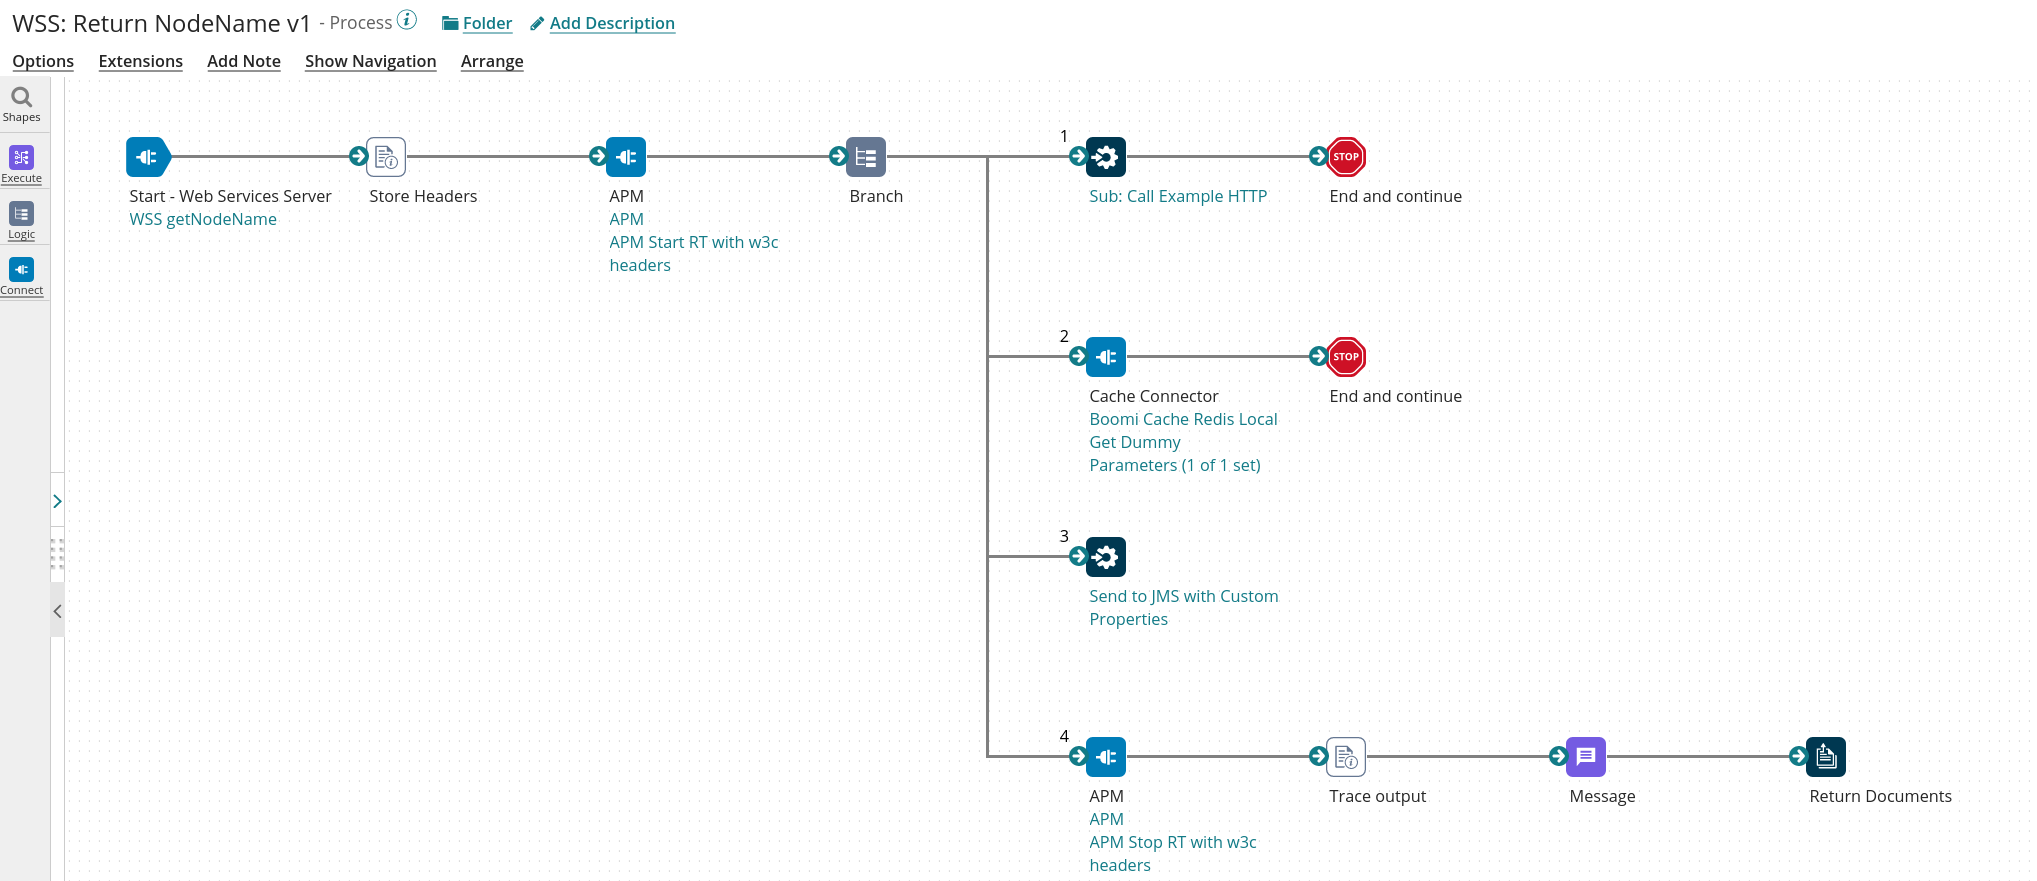
The changes are similar to the changes done in Scheduled Process except that the APM Operations are using different configuration:
- For a Start Operation:
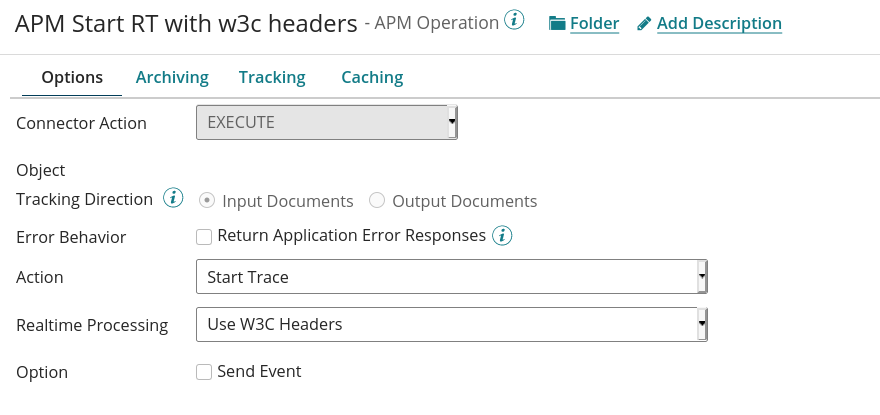
The Operation will use the the HTTP W3C Headers send by the API Consumer to correlate the context with current one.
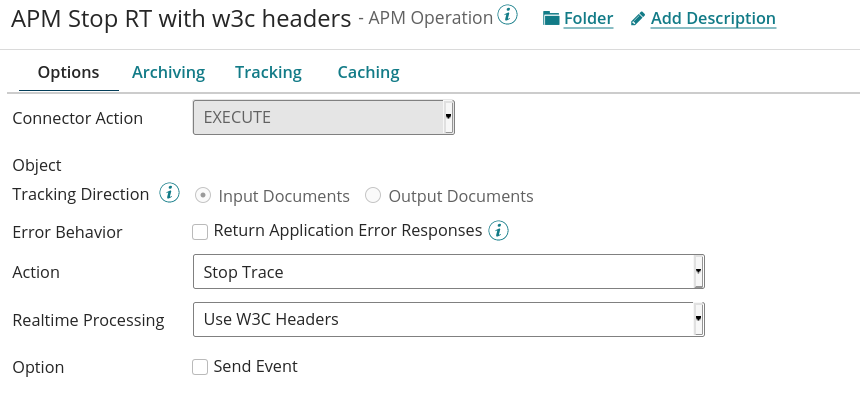
- For a Stop Operation:
Boomi JMS Processes
In the context of X-Ray, the Boomi API processes require a similar manual instrumentation as the API Process. You can also use the same APM Operation as they are working in the context of API and JMS Processes.
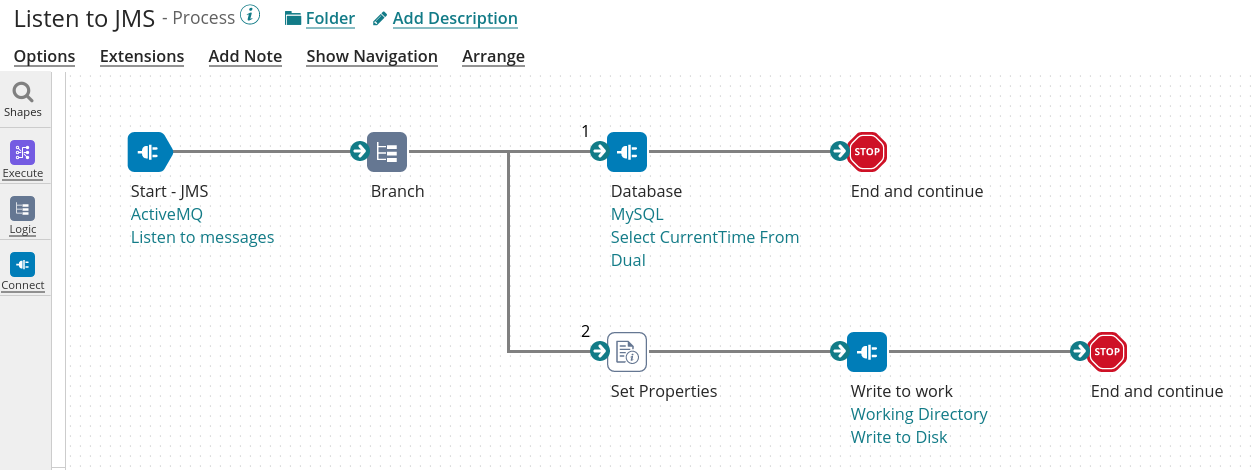
Boomi JMS Process before changes:
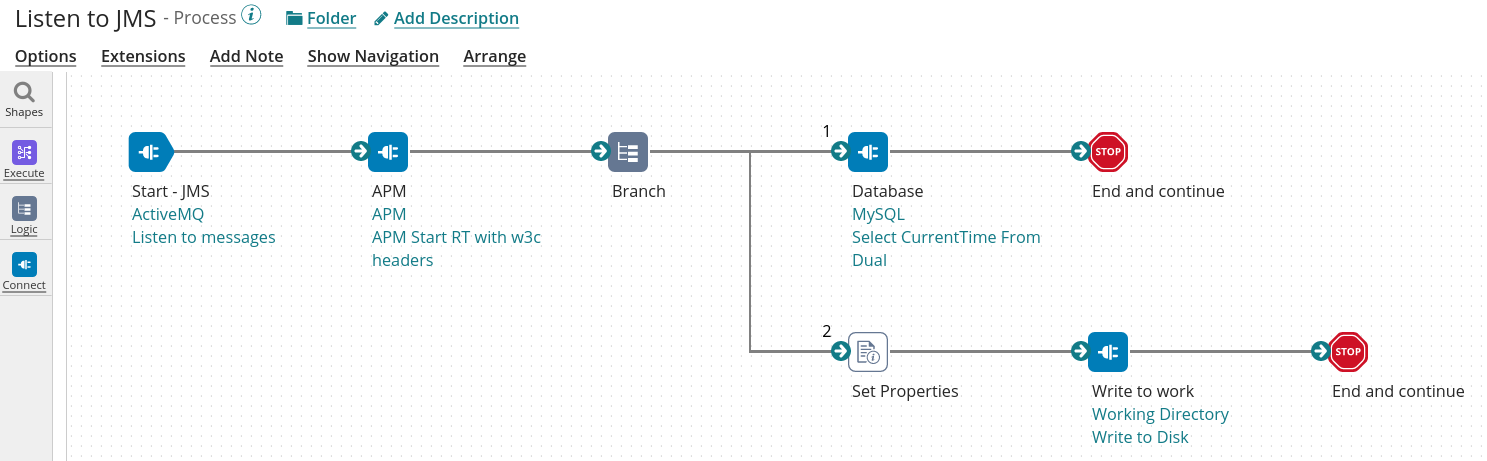
Boomi JMS Process after changes:
Review of the Observability with CloudWatch and X-Ray
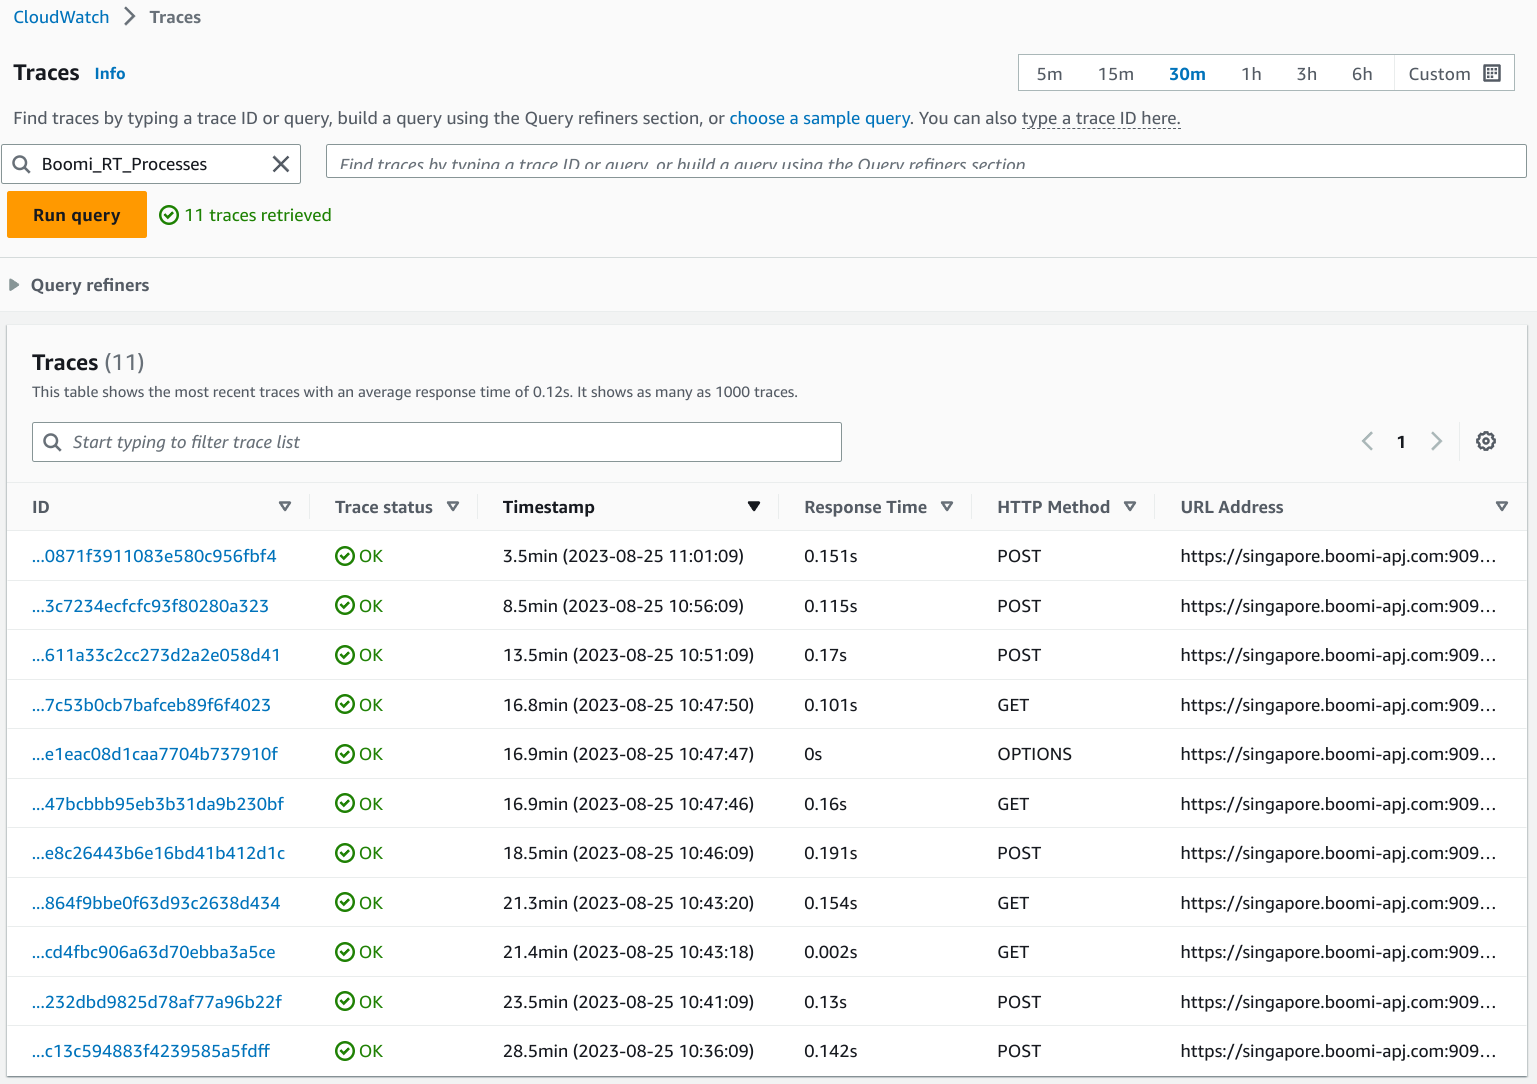
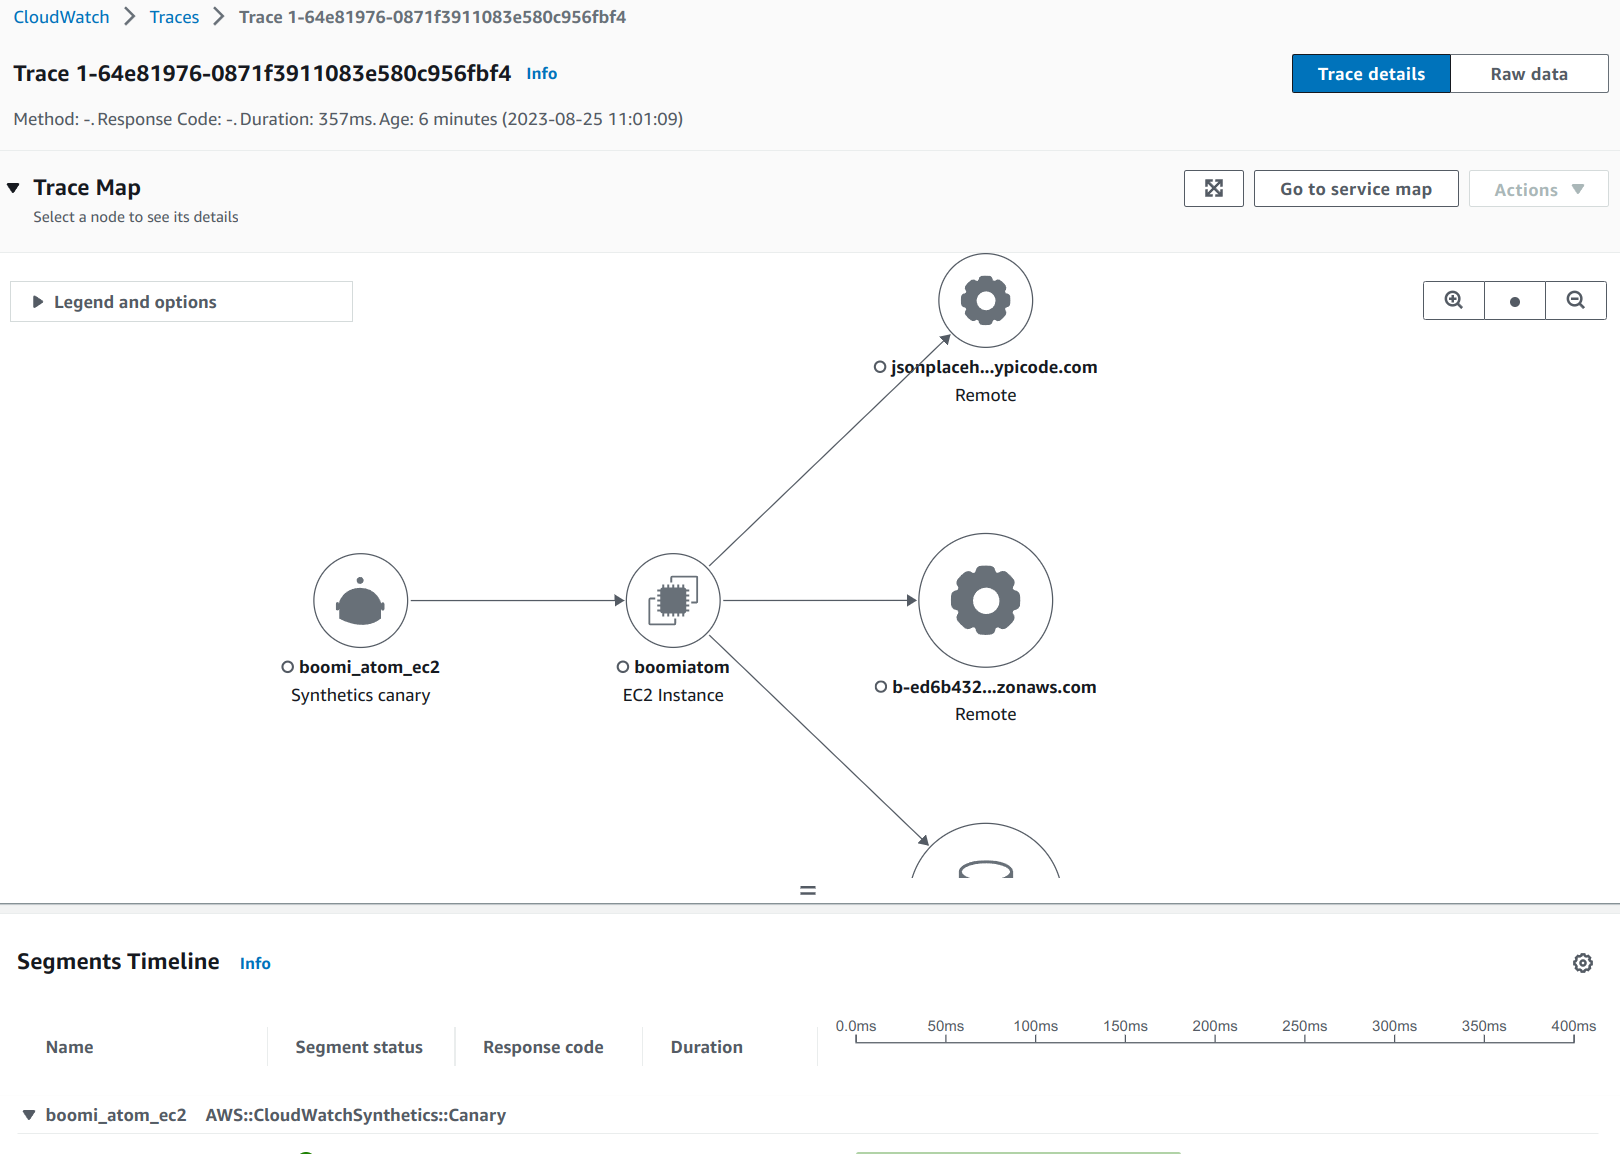
CloudWatch X-Ray Traces overview
After selecting a trace
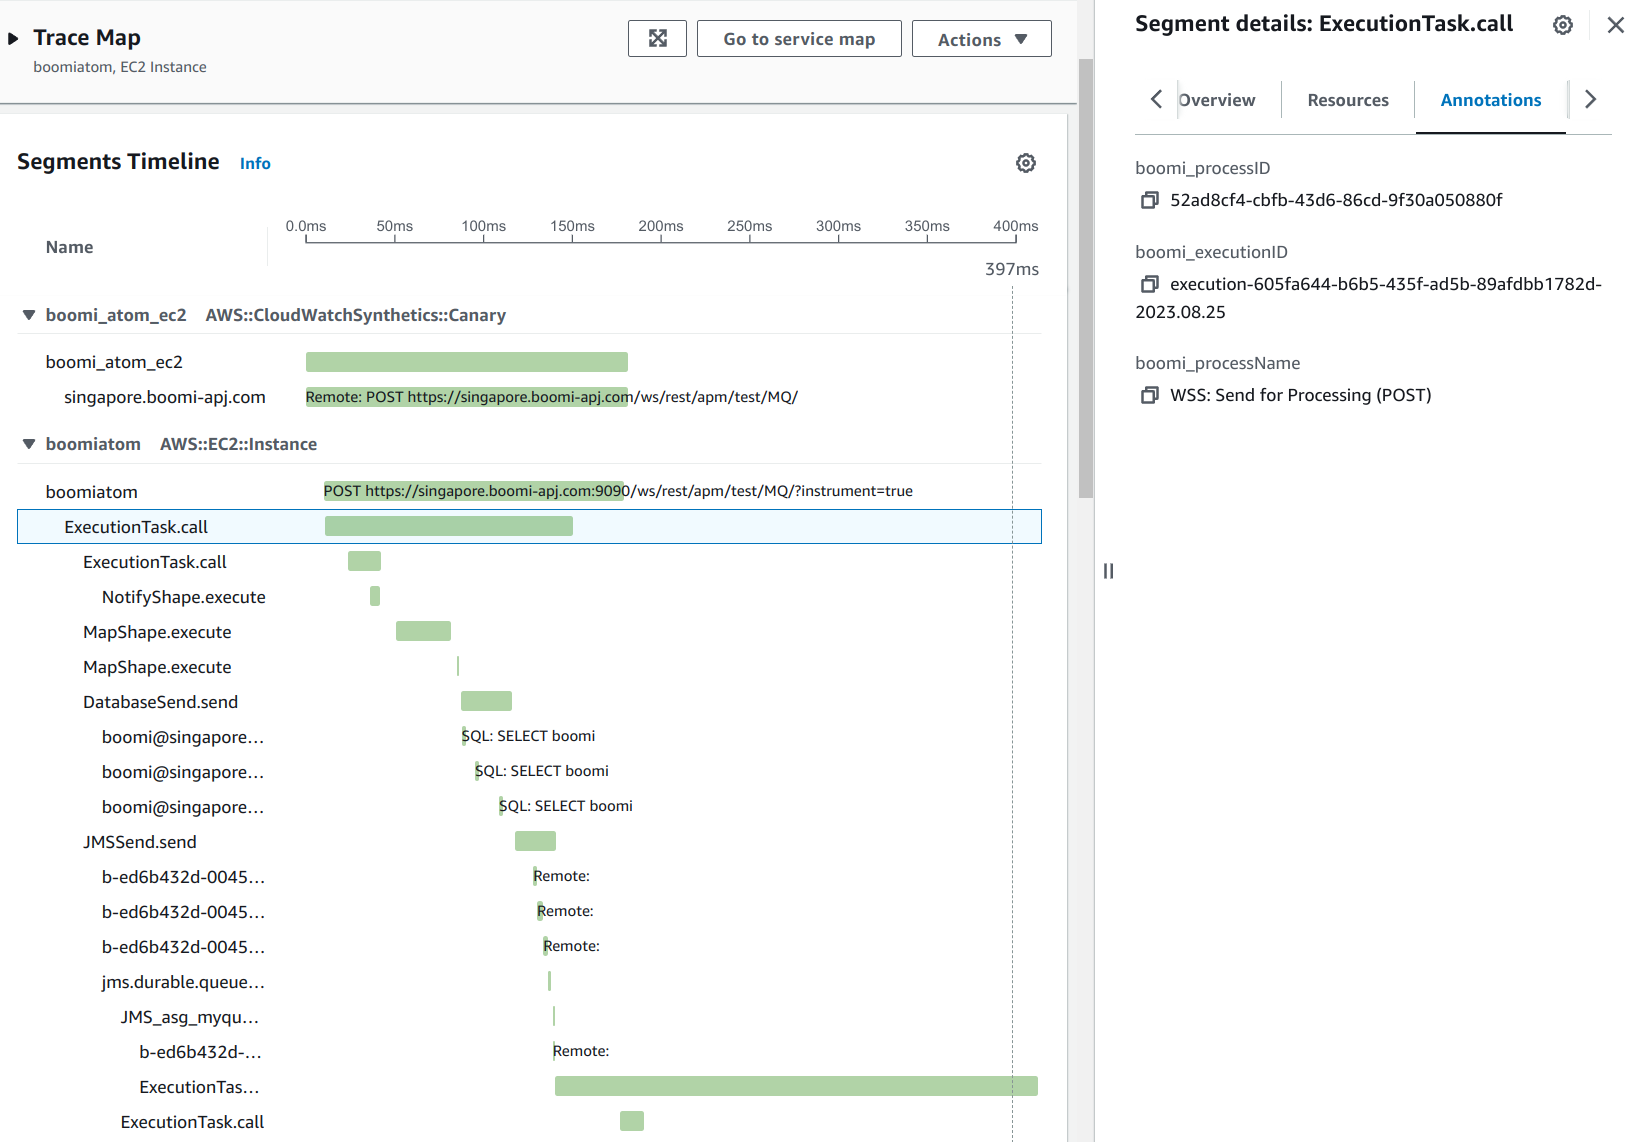
View of annotations
Select the first “ExecutionTask.call” segment to see Resources, Annotations, Metadata or Exception
You can now scroll down to the Logs associated to this trace (traces and logs need to be linked using the Boomi Log Framework)
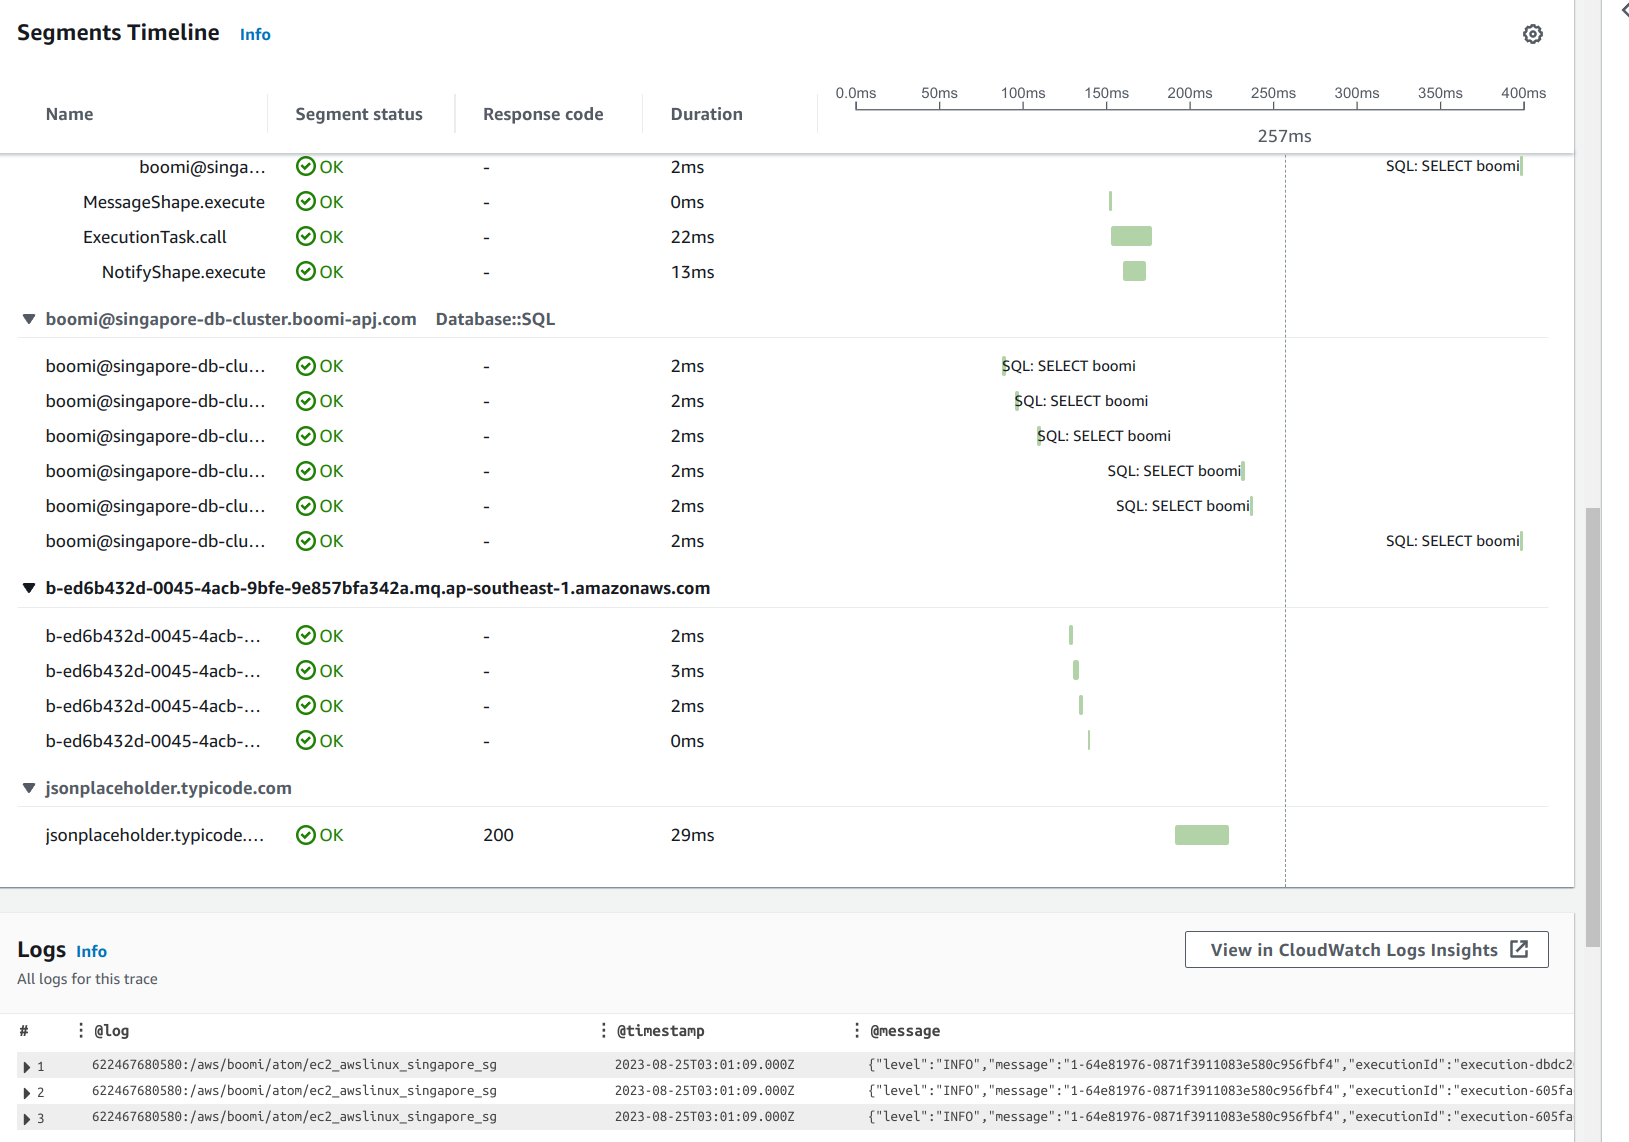
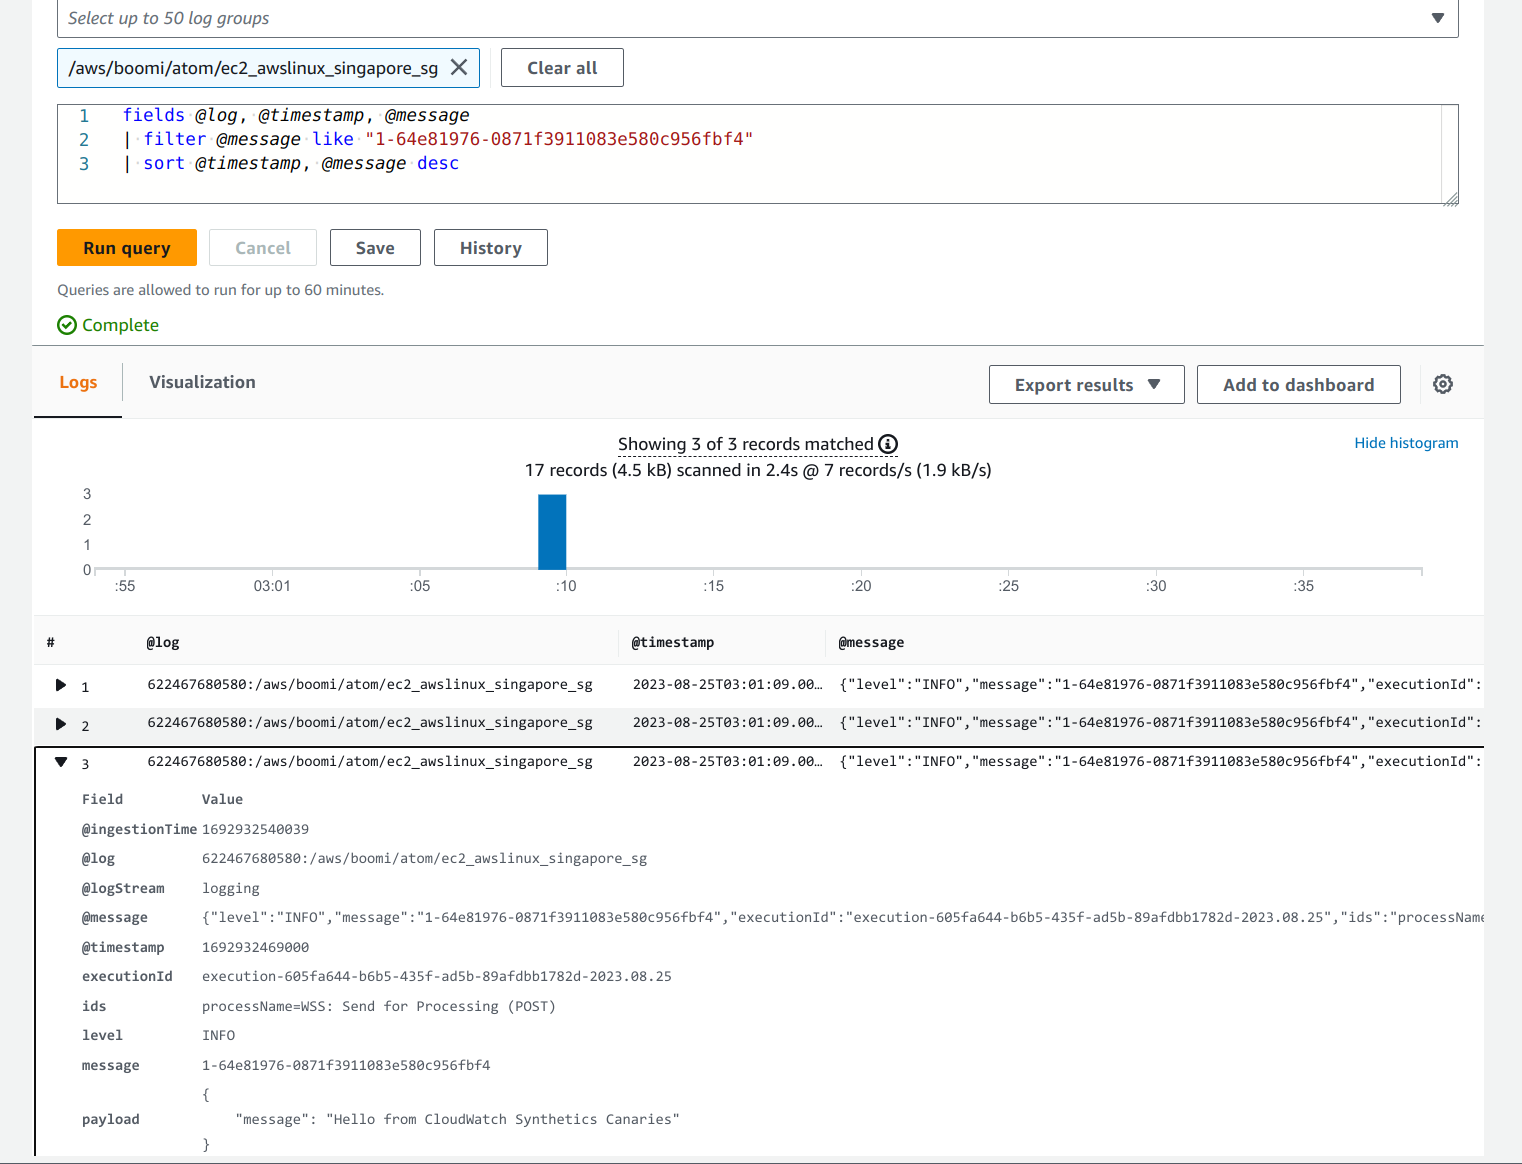
View of the logs (only)
To view more details on the logs, click on “View on CloudWatch Logs Insights”
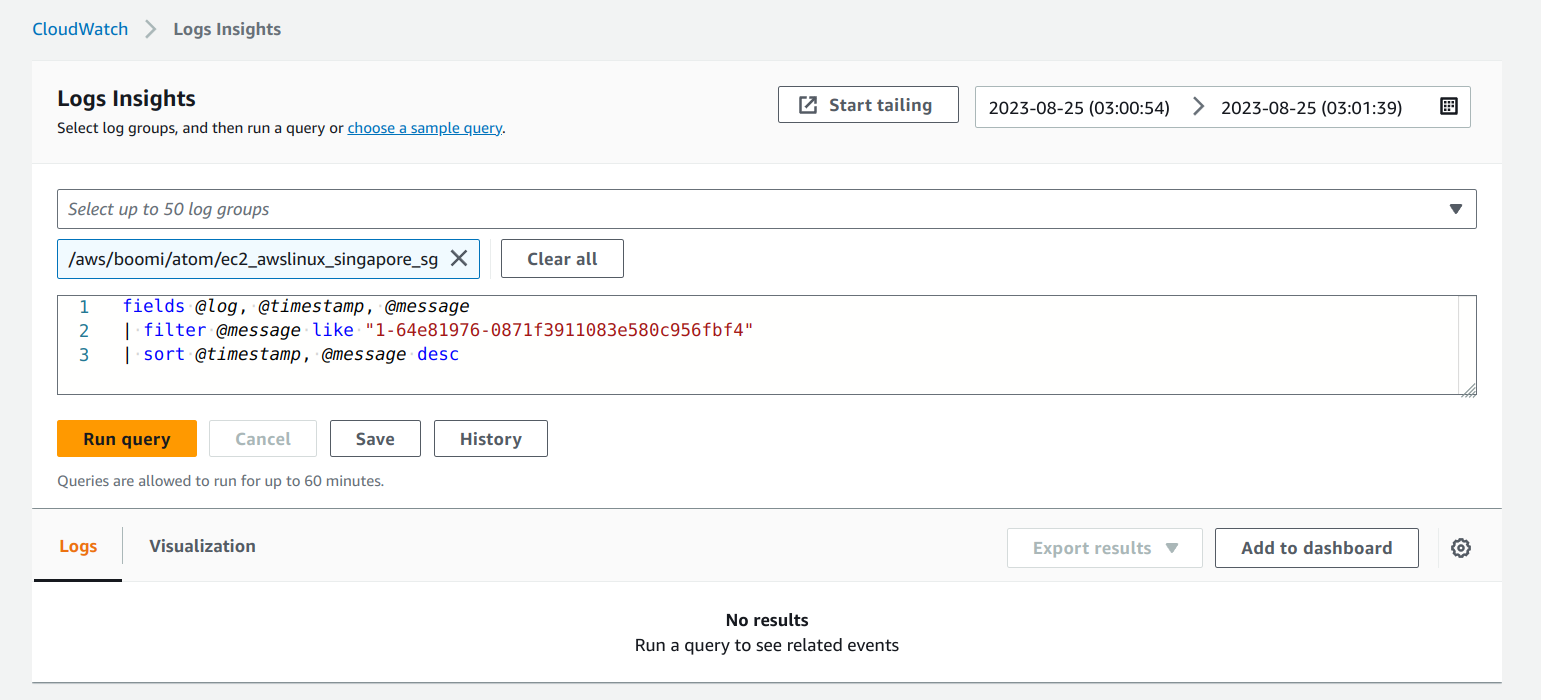
Click on “Run query”
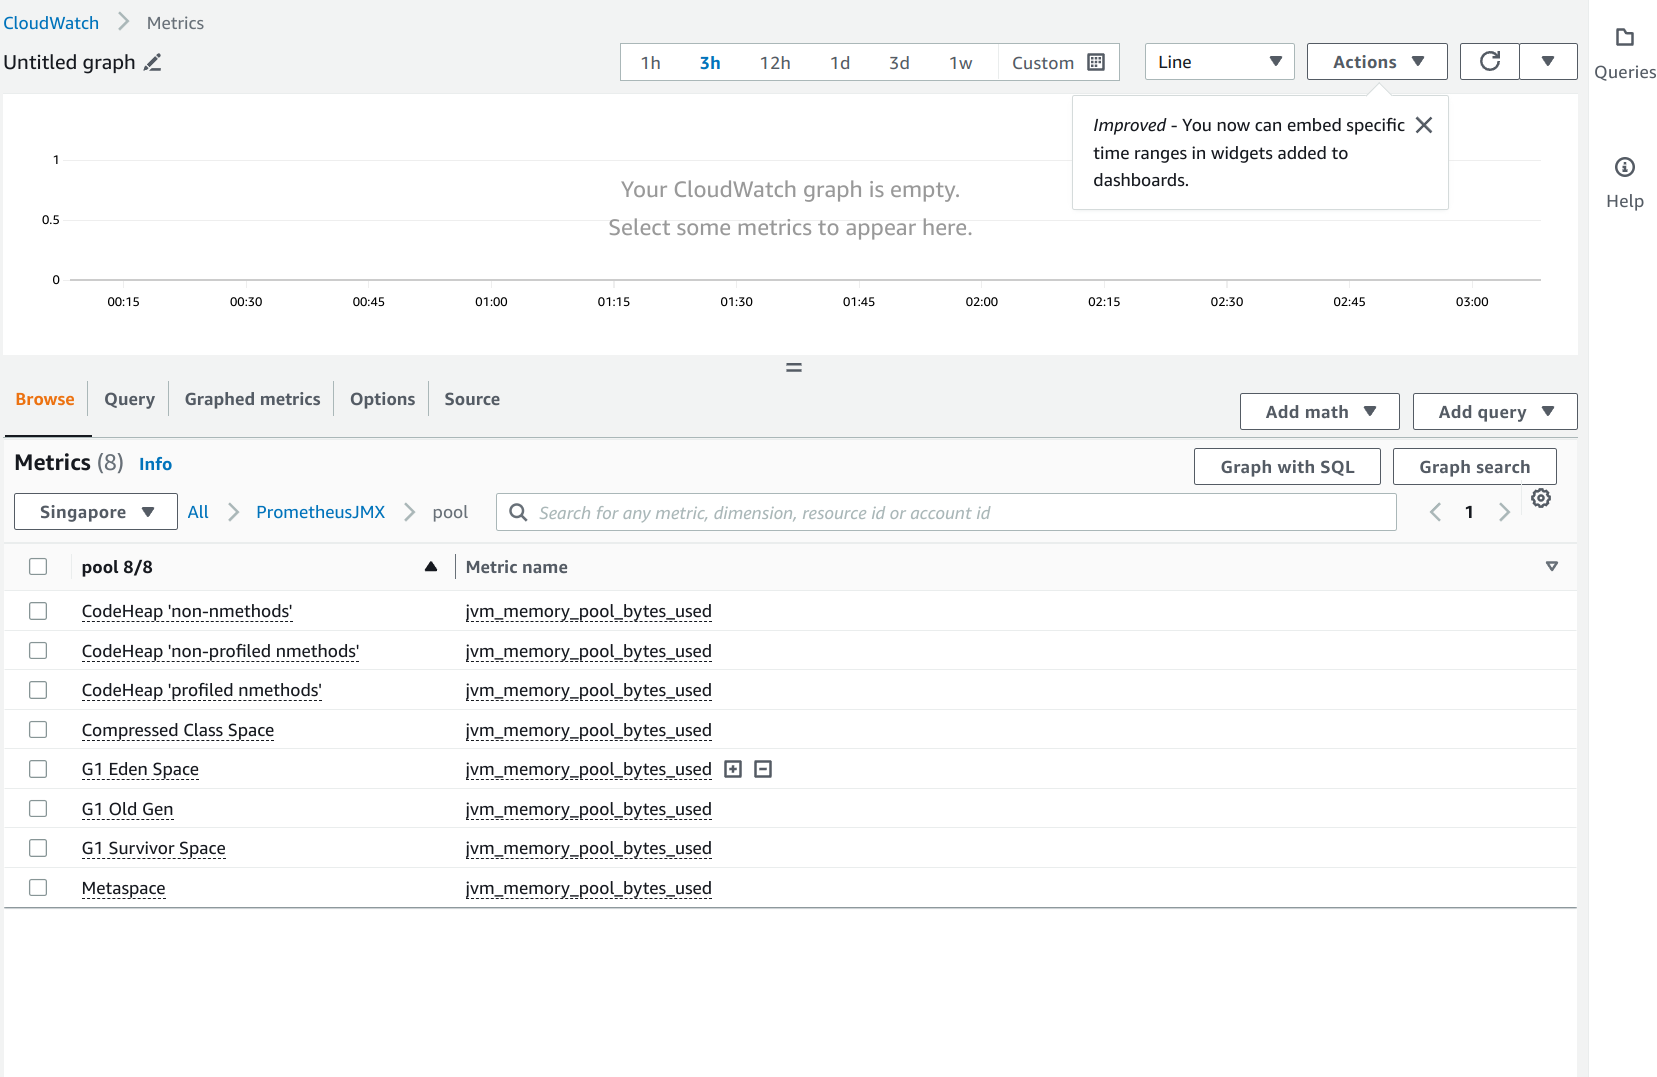
View of Metrics
View of raw metrics from Prometheus
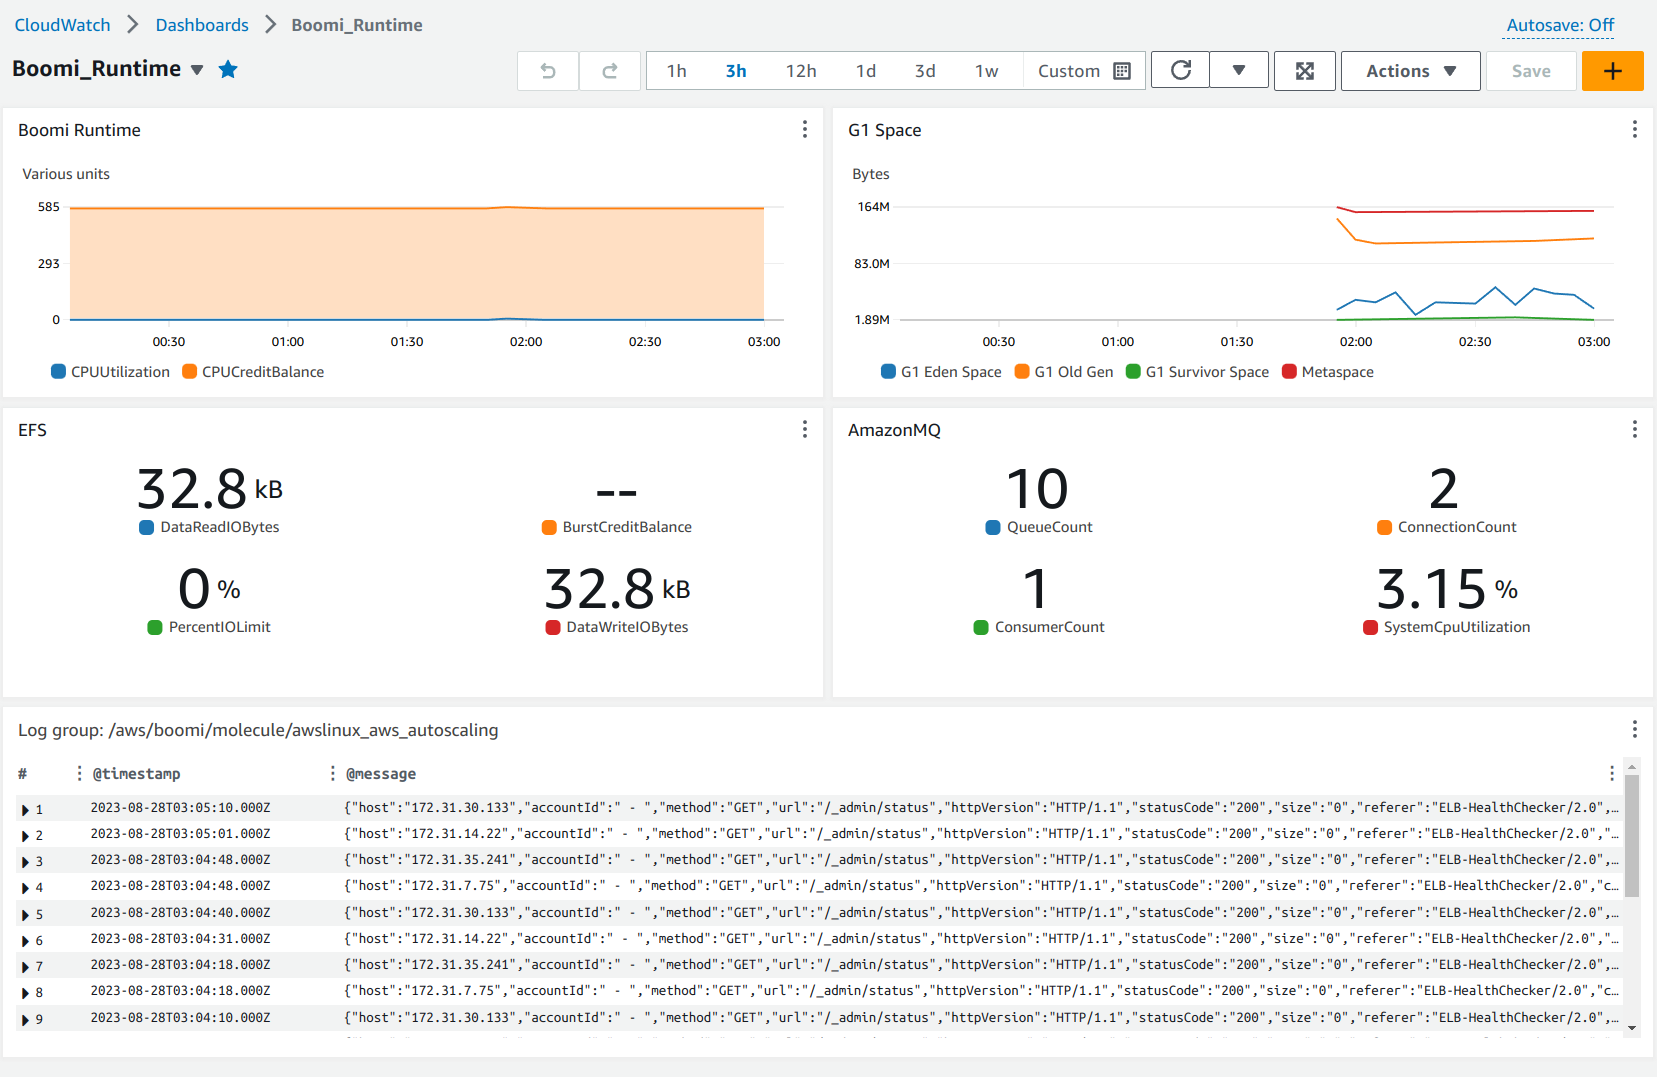
View of a custom dashboard with various metrics (and logs)