Introduction to Boomi Observability and use of Datadog
Introduction to Boomi Observability
Boomi is built on distributed components and heterogeneous systems to achieve fast and efficient low-code Integration.
Standard Log Monitoring is usually the first step used to extract technical logs generated by the different Boomi Components. A second step is usually the setup of System/Network Monitoring to extract Metrics from the underlying Network, Servers, VMs and Cloud Runtime. Tracing can be the third step even if only few project is implementing it.
Observability is not a tool by itself but is a property of distributed systems which allows you to combine all the information extracted with the three previous steps (plus some others) to provide a single holistic view.
Let’s use the following use-case:
- We have a Mobile Application calling an API deployed in Boomi
- The Boomi API (first Boomi Process) persist some data in a Database and then send a message RabbitMQ
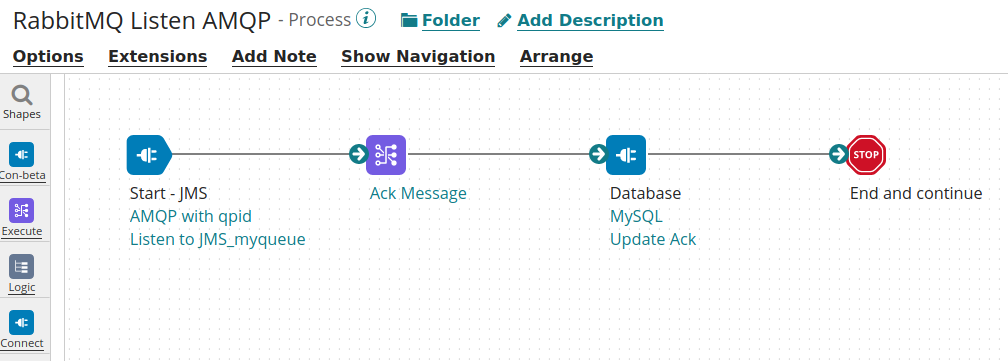
- A second Boomi process listen to RabbitMQ, doing some processing when he receive the message and then update the DB
- A third Boomi process querying the Database and generating a file for Analytics purpose, this process is executed on a schedule base
This scenario is common and is quite simplified but we can already see that we have a multitude of components to monitor, a dozen of different logs and the need for end-to-end visibility:
- if a API call from the Browser is failing, where do find the problem?
- more problematic, if API call from some of my customers are slow during the evening, how do we investigate?
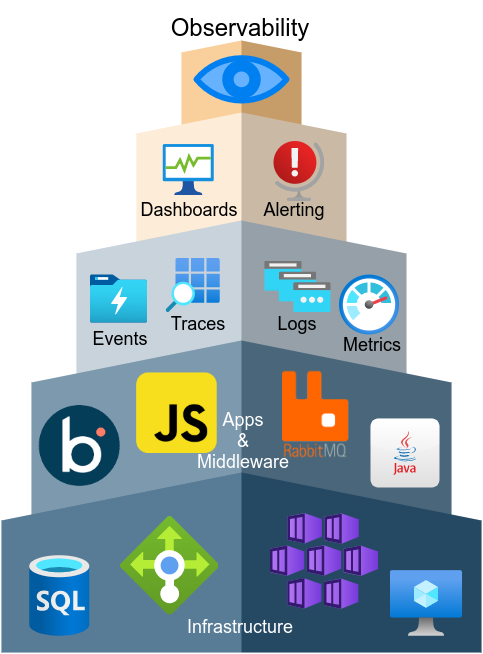
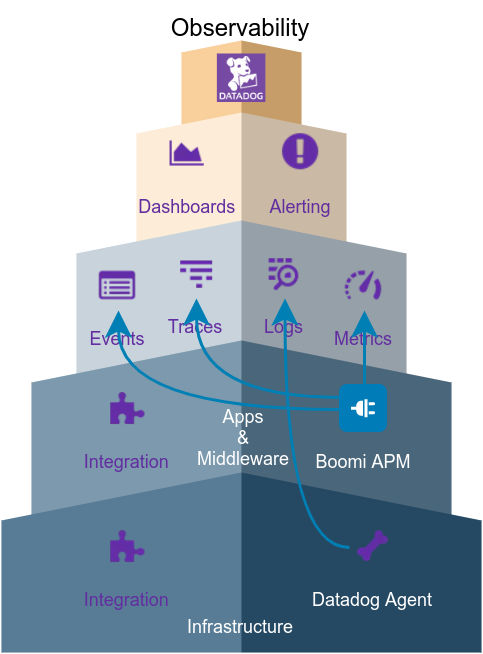
Observability
There will be a lot more scenarios but having a Observable system would help us minimizing the the previous problems by (bottom-up):
- Ensuring that all underlying Infrastructure is monitored, metrics and status is propagated to the Monitoring Platform
- All Applications metrics, traces, logs and events are correlated and linked with the previous data
- Dashboards and Alerts and based on all the Infrastructure and Application data
The Deployment diagram with the different elements will be the following:
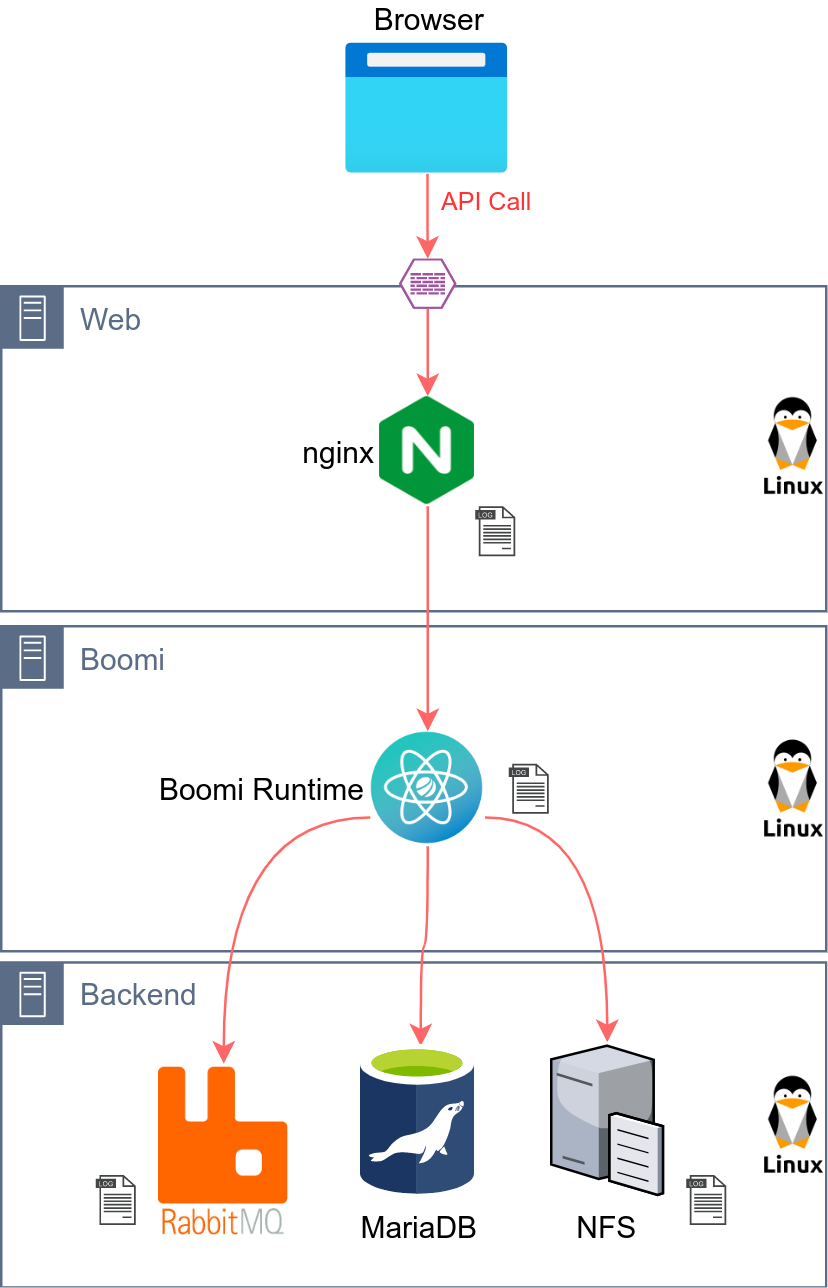
Overview of Components
| Layer | Component | Detail and roles |
|---|---|---|
| Internet | Browser | Internet Browser acting as API Consumer |
| Web | nginx | Lightweight Web Server/Reverse Proxy. Forwarding the requests to the Boomi Runtime (Gateway) |
| Boomi | Gateway | Validate the API Call, apply policies and forward to Boomi Molecule |
| Boomi | Molecule | Execute the Boomi Processes: * Real-time: API and JMS * Batch: all Non-Real-time Processes (DB, File, SFTP…) |
| Backend | RabbitMQ | JMS Broker used to persist messages |
| Backend | MariaDB | SQL Database used to store Business data |
| Backend | NFS | Shared Storage for Boomi Molecule folder and other File transfer storage |
Overview of the Boomi Processes
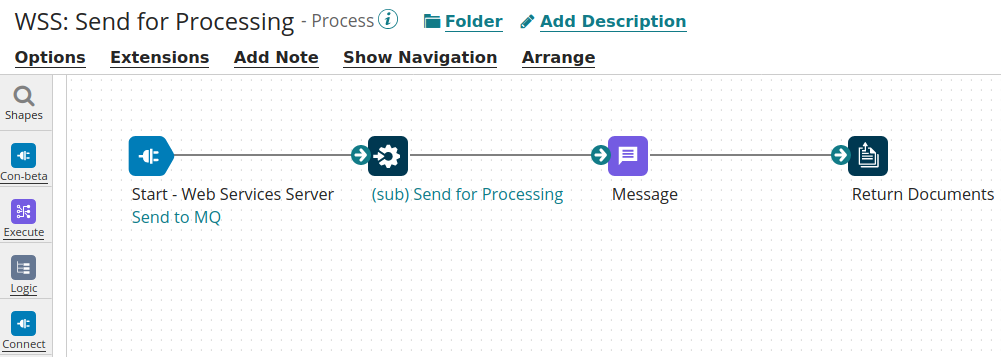
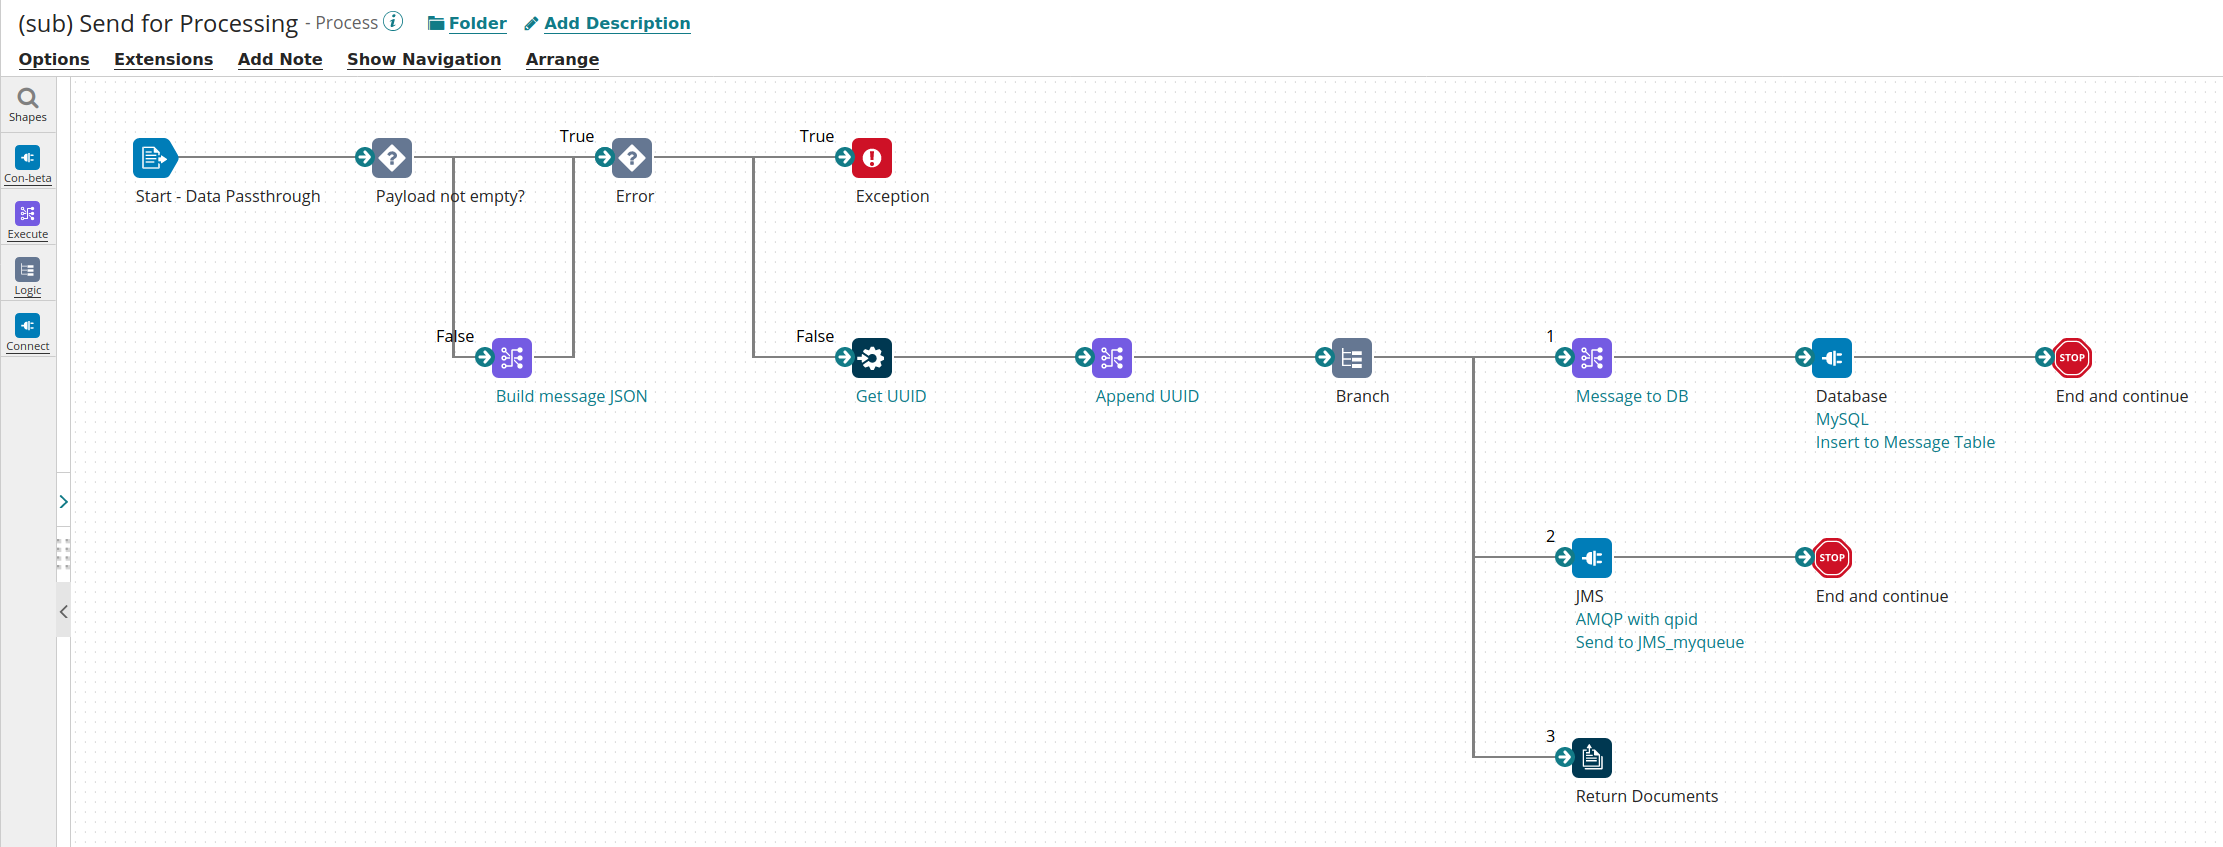
API: First Process with Sub-Process
JMS Listener: Second Process
Batch Process: executed on a schedule base
Implementation with a Monitoring Platform for Observability with Datadog
Agent Installation
The first step consists of installing the Datadog Agent on each server. This step will link the server (or Cloud resource) to Datadog and will allows the gathering of metrics, status of server, processes, network, etc.
Log Configuration
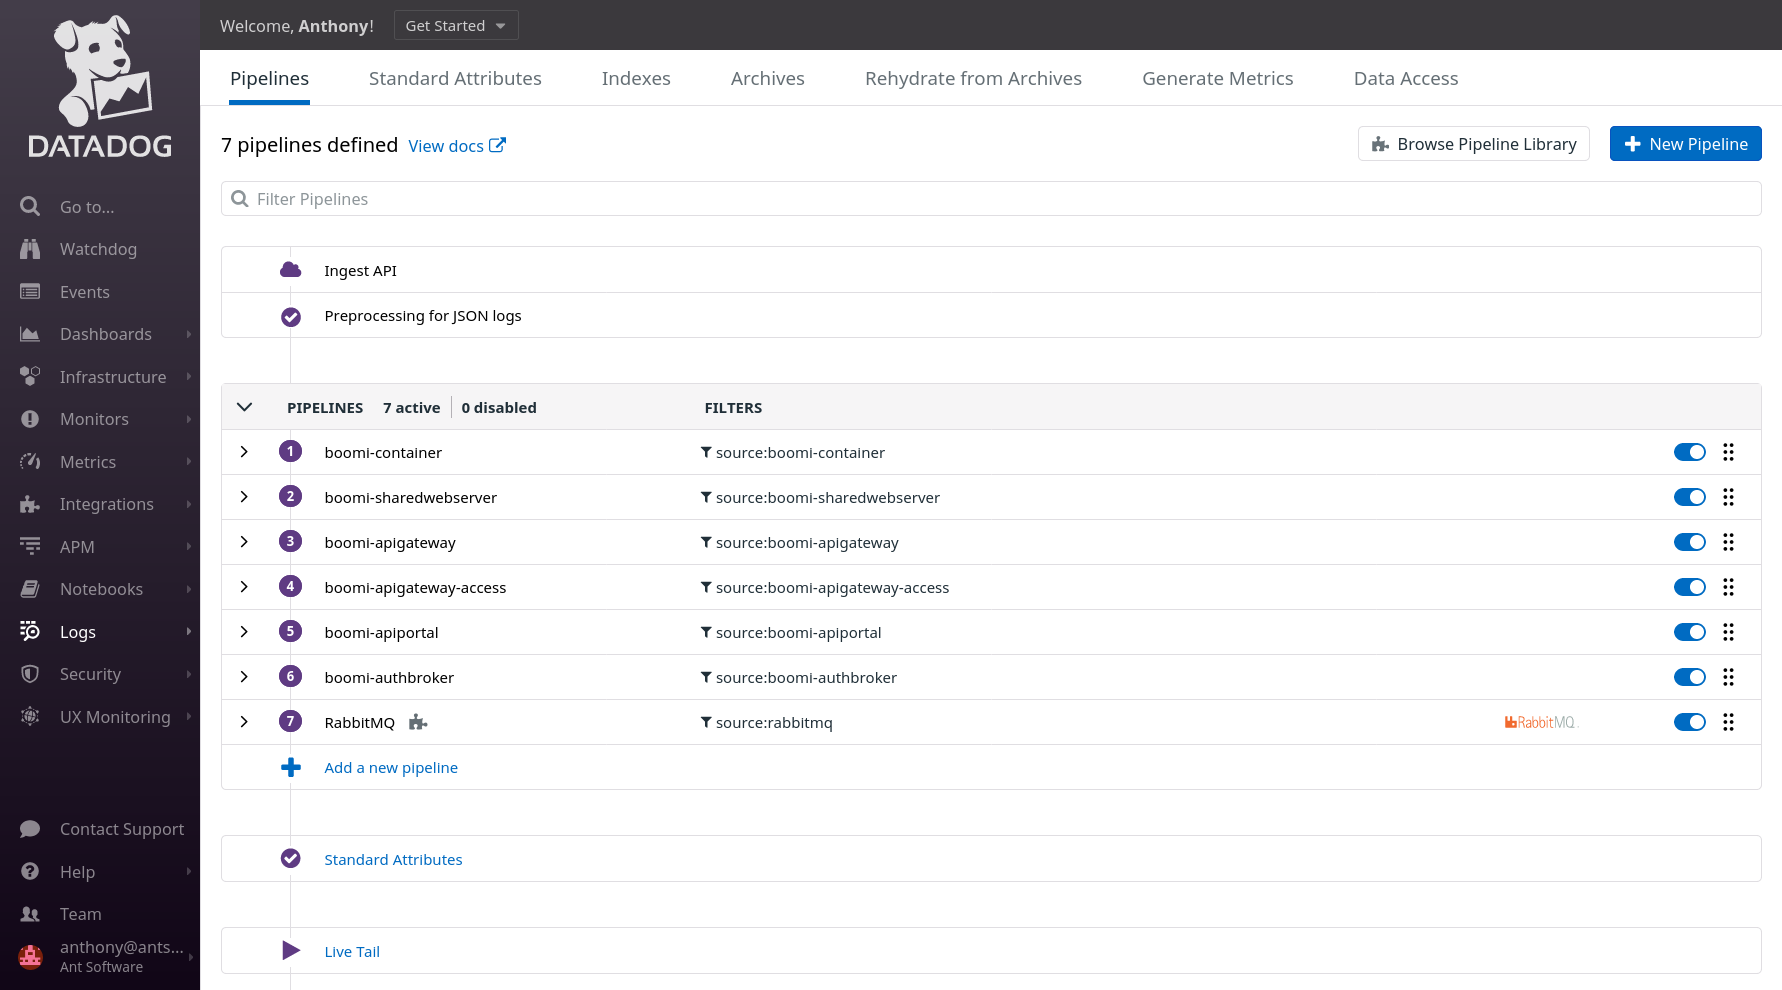
The Log configuration will follow and will consist of several sub-steps, the first one will consist on the configuration of the Pipeline for each type of logs: in our Deployment, we have 6 types of logs for Boomi.
The second sub-steps will consists of the creation of a yaml file on each server to instruct the Datadog agent to scrap a log file.
One example of a Boomi Molecule (on the first node, file location is /etc/datadog-agent/conf.d/boomi.d/conf.yaml):
logs:
  - type: file
    path: /mnt/nfs/centos_molecule/Boomi_AtomSphere/Molecule/Molecule_centos_linux_cluster/logs/*.container.192_168_0_119.log
    service: boomimolecule
    source: boomi-container
    log_processing_rules:
      - type: multi\_line
        name: boomi-container-startwithdate
        pattern: \\w{3}\\s+\\d{2},

  - type: file
    path: /mnt/nfs/centos_molecule/Boomi_AtomSphere/Molecule/Molecule_centos_linux_cluster/logs/*.shared_http_server.192_168_0_119.log
    service: boomimolecule
    source: boomi-sharedwebserver
APM Setup
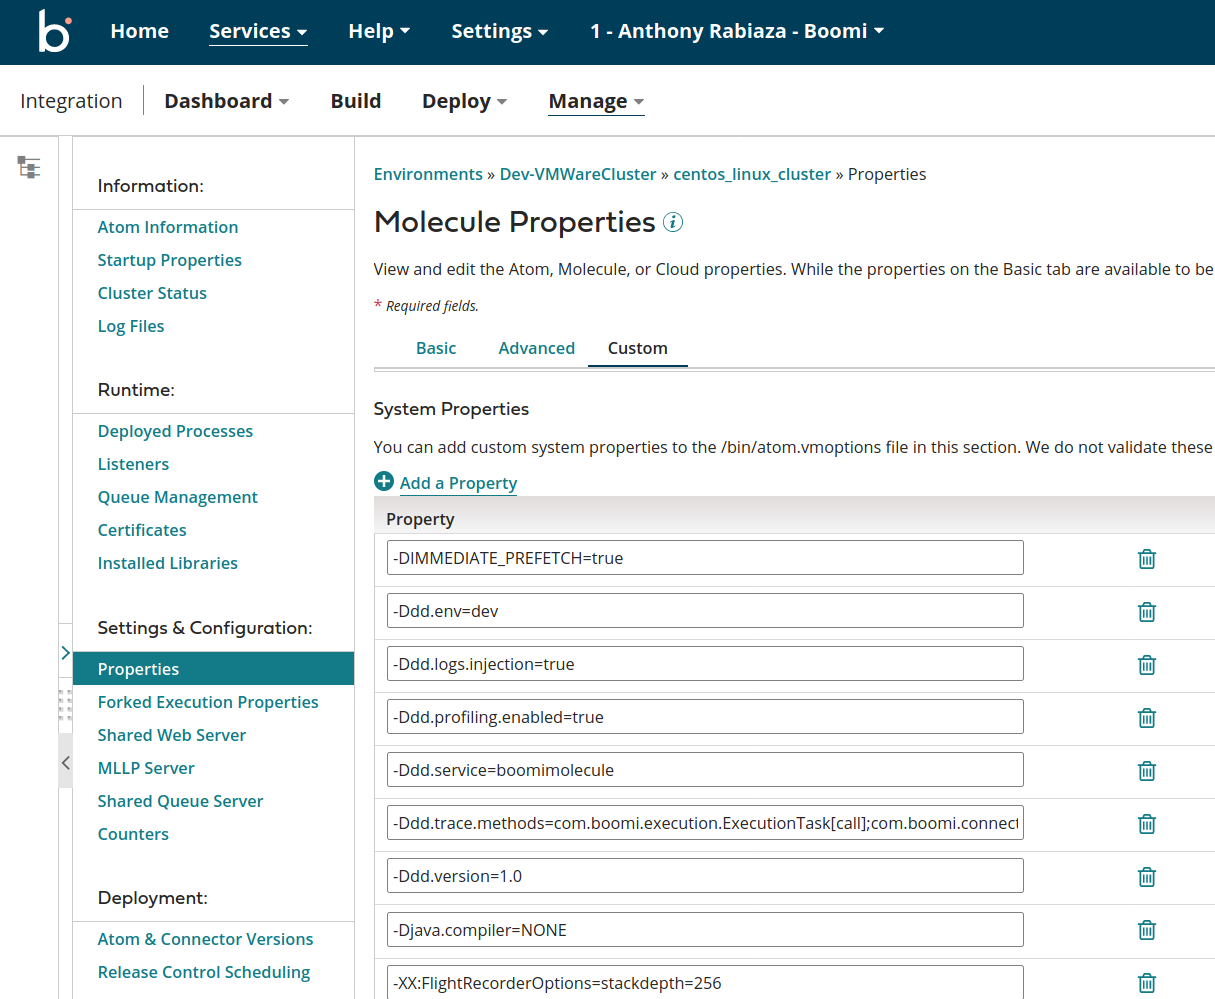
The Datadog Java Agent (Jar) needs to be deployed on each node or deployed on the Shared Server accessible by all nodes, once this is done Boomi System properties needs to be updated via Boomi AtomSphere:
APM Configuration: Tracing, Custom Events and Custom Metrics
Boomi API Processes and Boomi JMS Processes
In the context of Datadog, the Boomi API processes do not require any change, they will be automatically detected by Datadog and instrumentation will be required only to get advanced metadata (see next section).
The operation name (for instance /ws/rest/apm/test/MQ/) and the HTTP method will help us to identify the API process executed.
Boomi Scheduled Processes
The Boomi Scheduled processes will also be detected by Datadog due to the configuration in Boomi AtomSphere.
But the name of the process and other details won’t be available. An manual instrumentation of the process will be required to get this details: the use of Boomi APM Connector will minimize the changes:
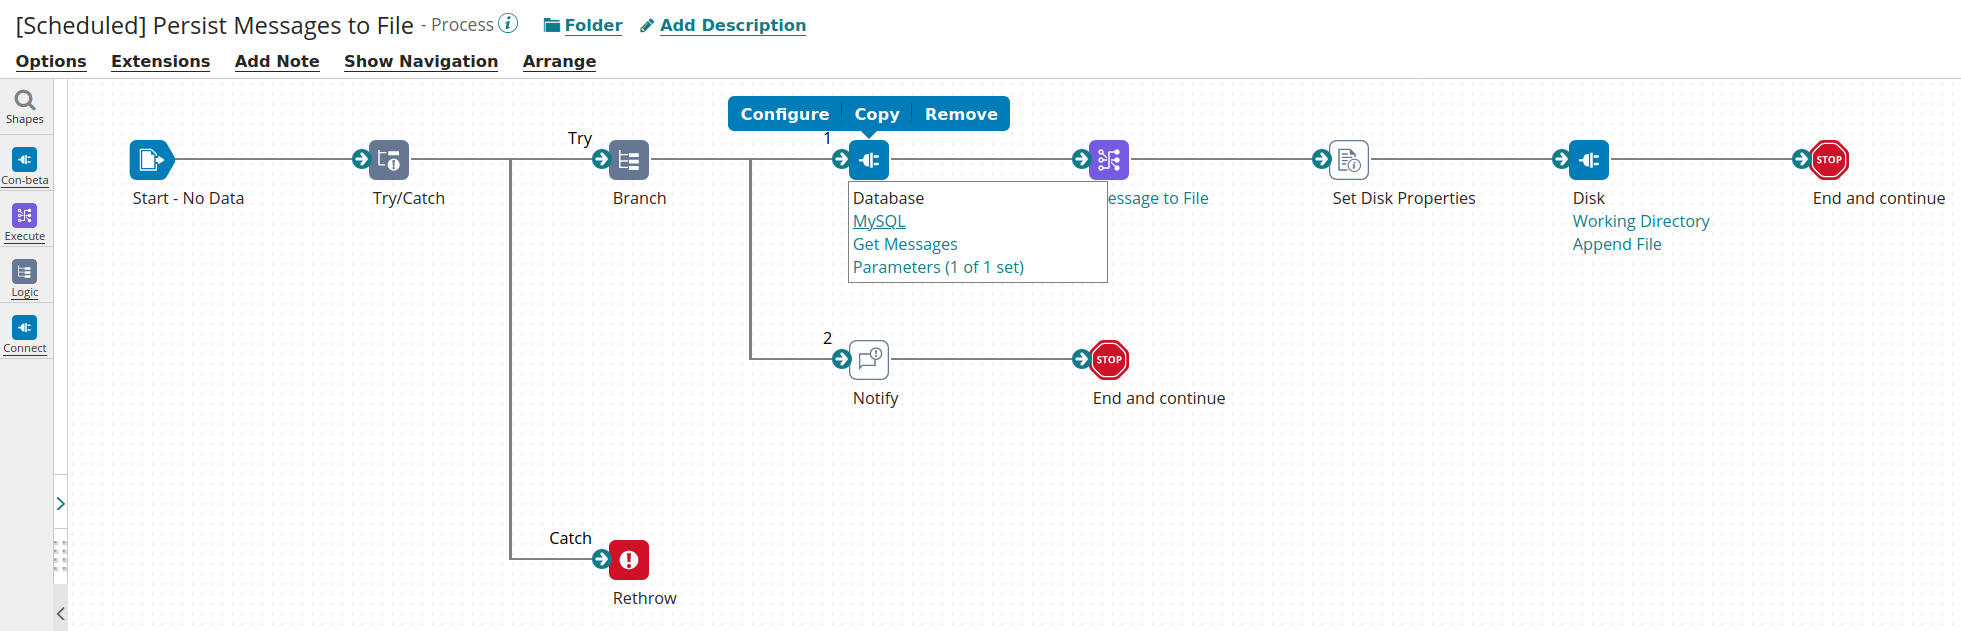
The updated process will looks like the following:
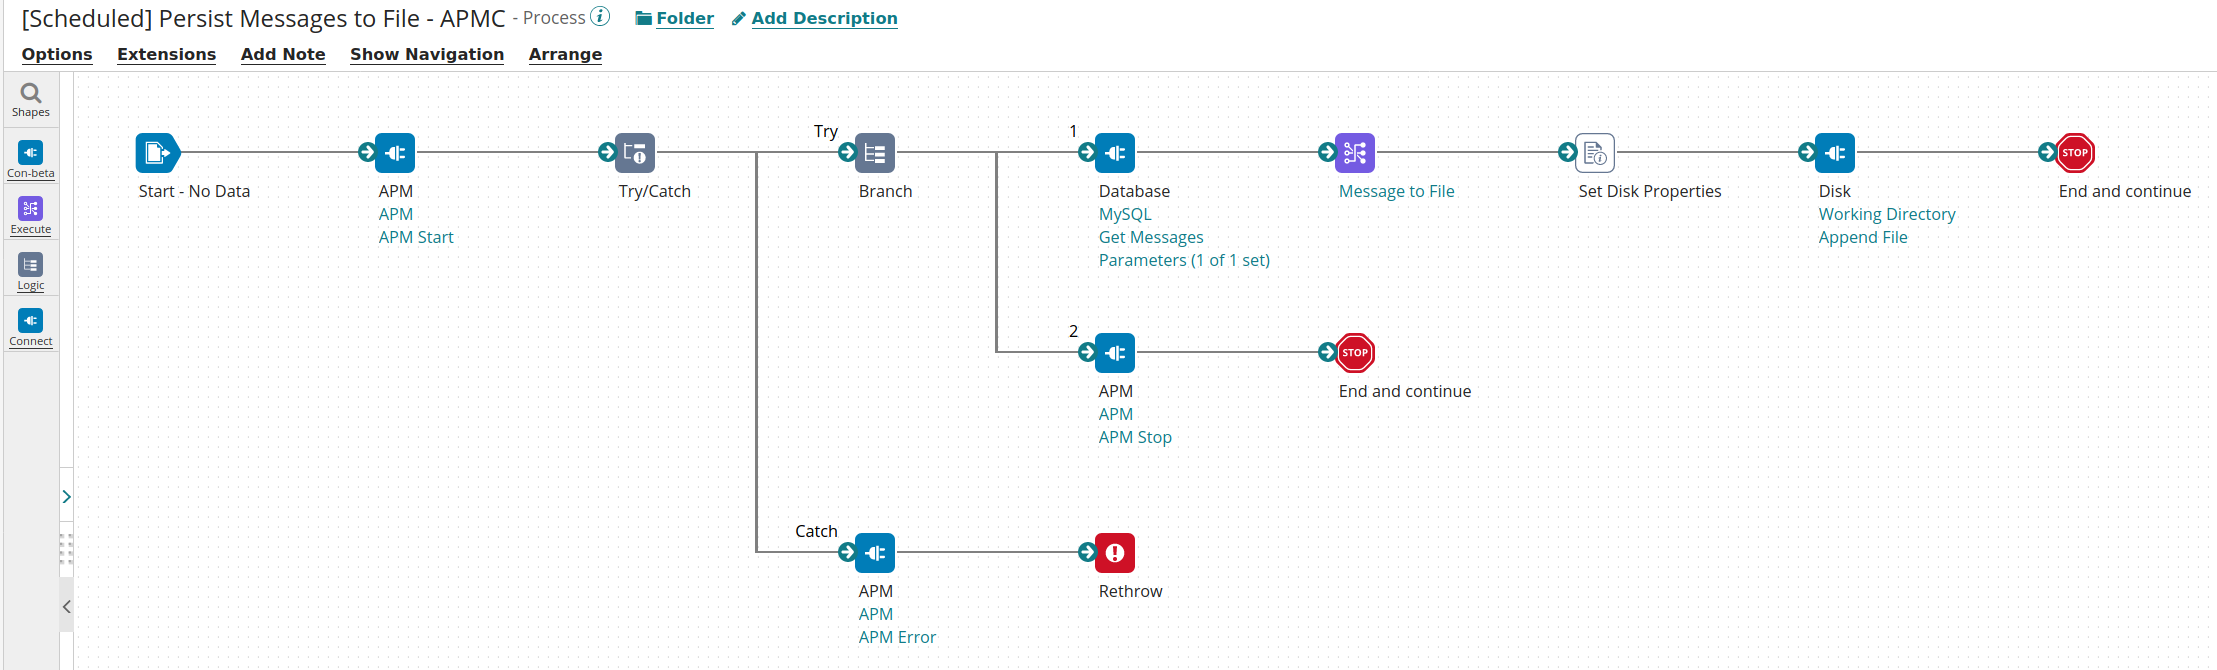
The changes includes:
- The APM Start shape at the beginning
- The APM Stop shape before the last End, please note that we created a branch here as the Disk shape (Get) might not returned a Document thus an APM Stop shape after the Disk might not be called
- The APM Error in the try catch
The Boomi APM Connector will allow the Instrumentation of any Boomi Processes and will provide:
- Tracing: 3 steps: Start, Stop or Error
- Eventing, in Stop or Error steps and event can be sent to Datadog to inform of the success or failure of the process (including all details: server, time, environment, execution context…)
- Custom Metrics: a Boomi Process can send metrics related to business data or systems to Datadog
Review of the Observability with Datadog

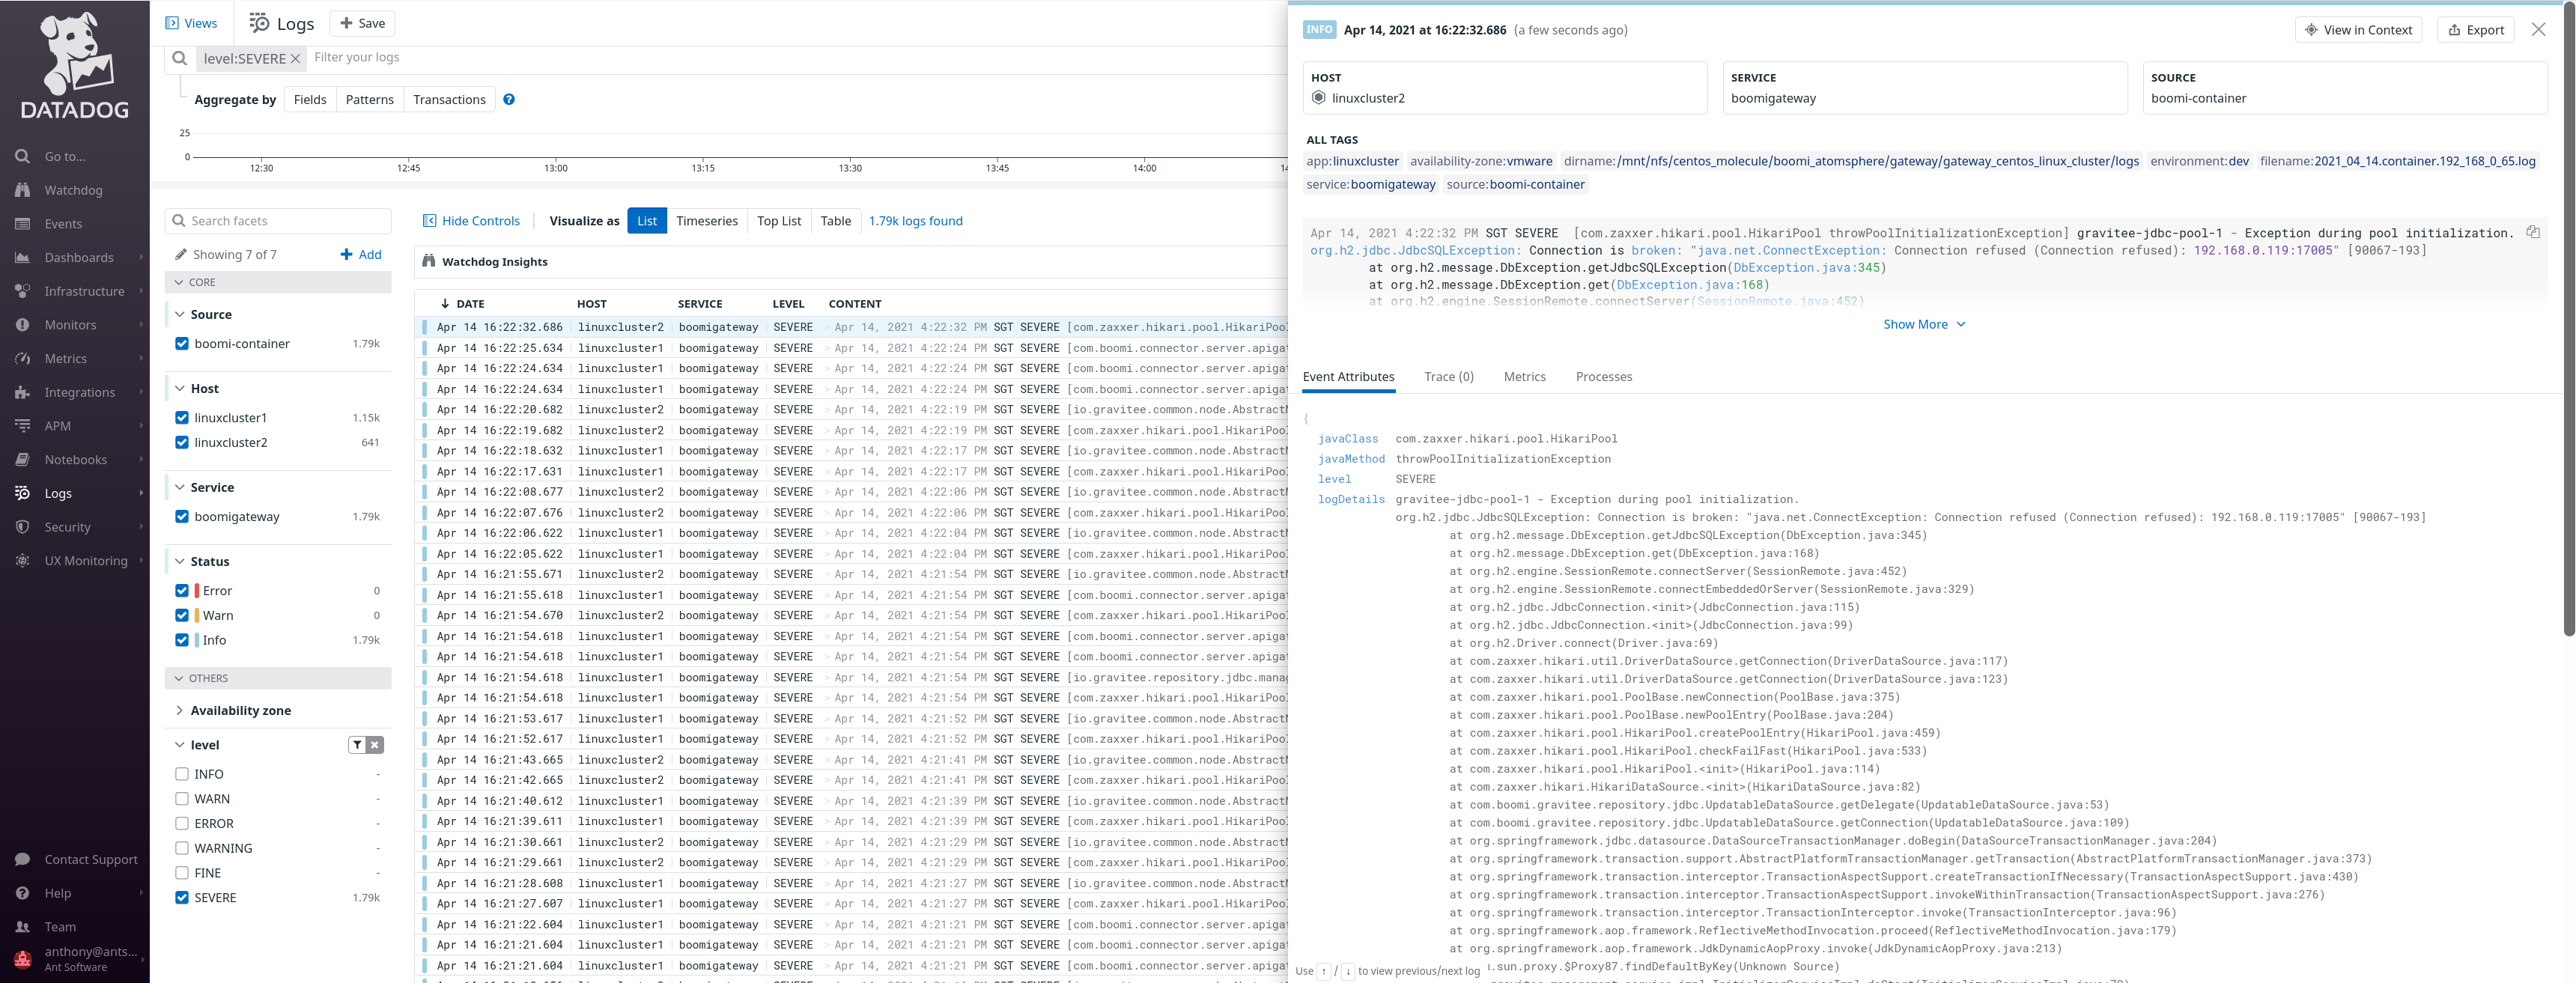
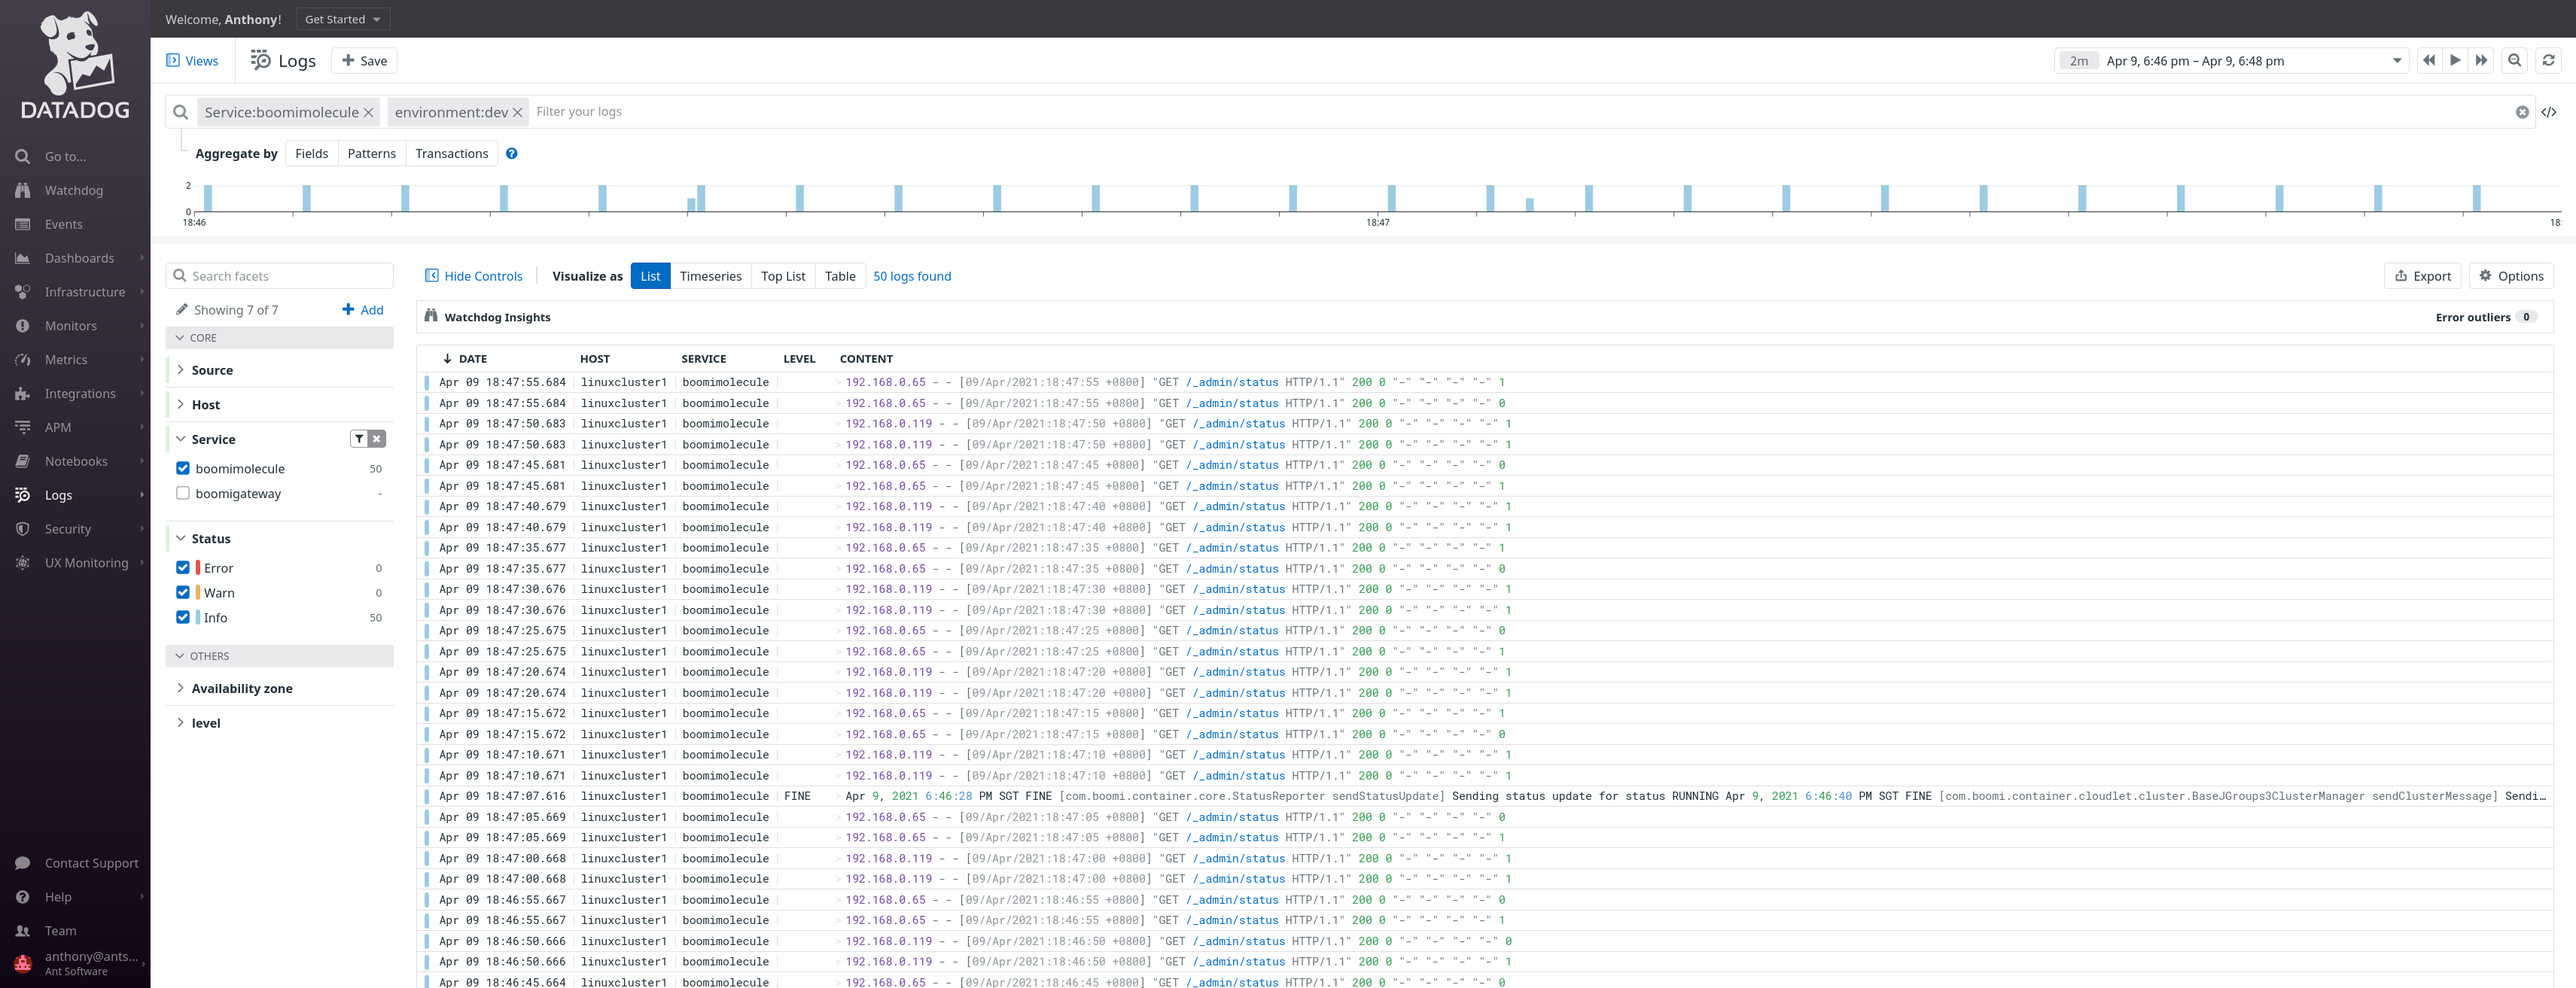
View of Logs
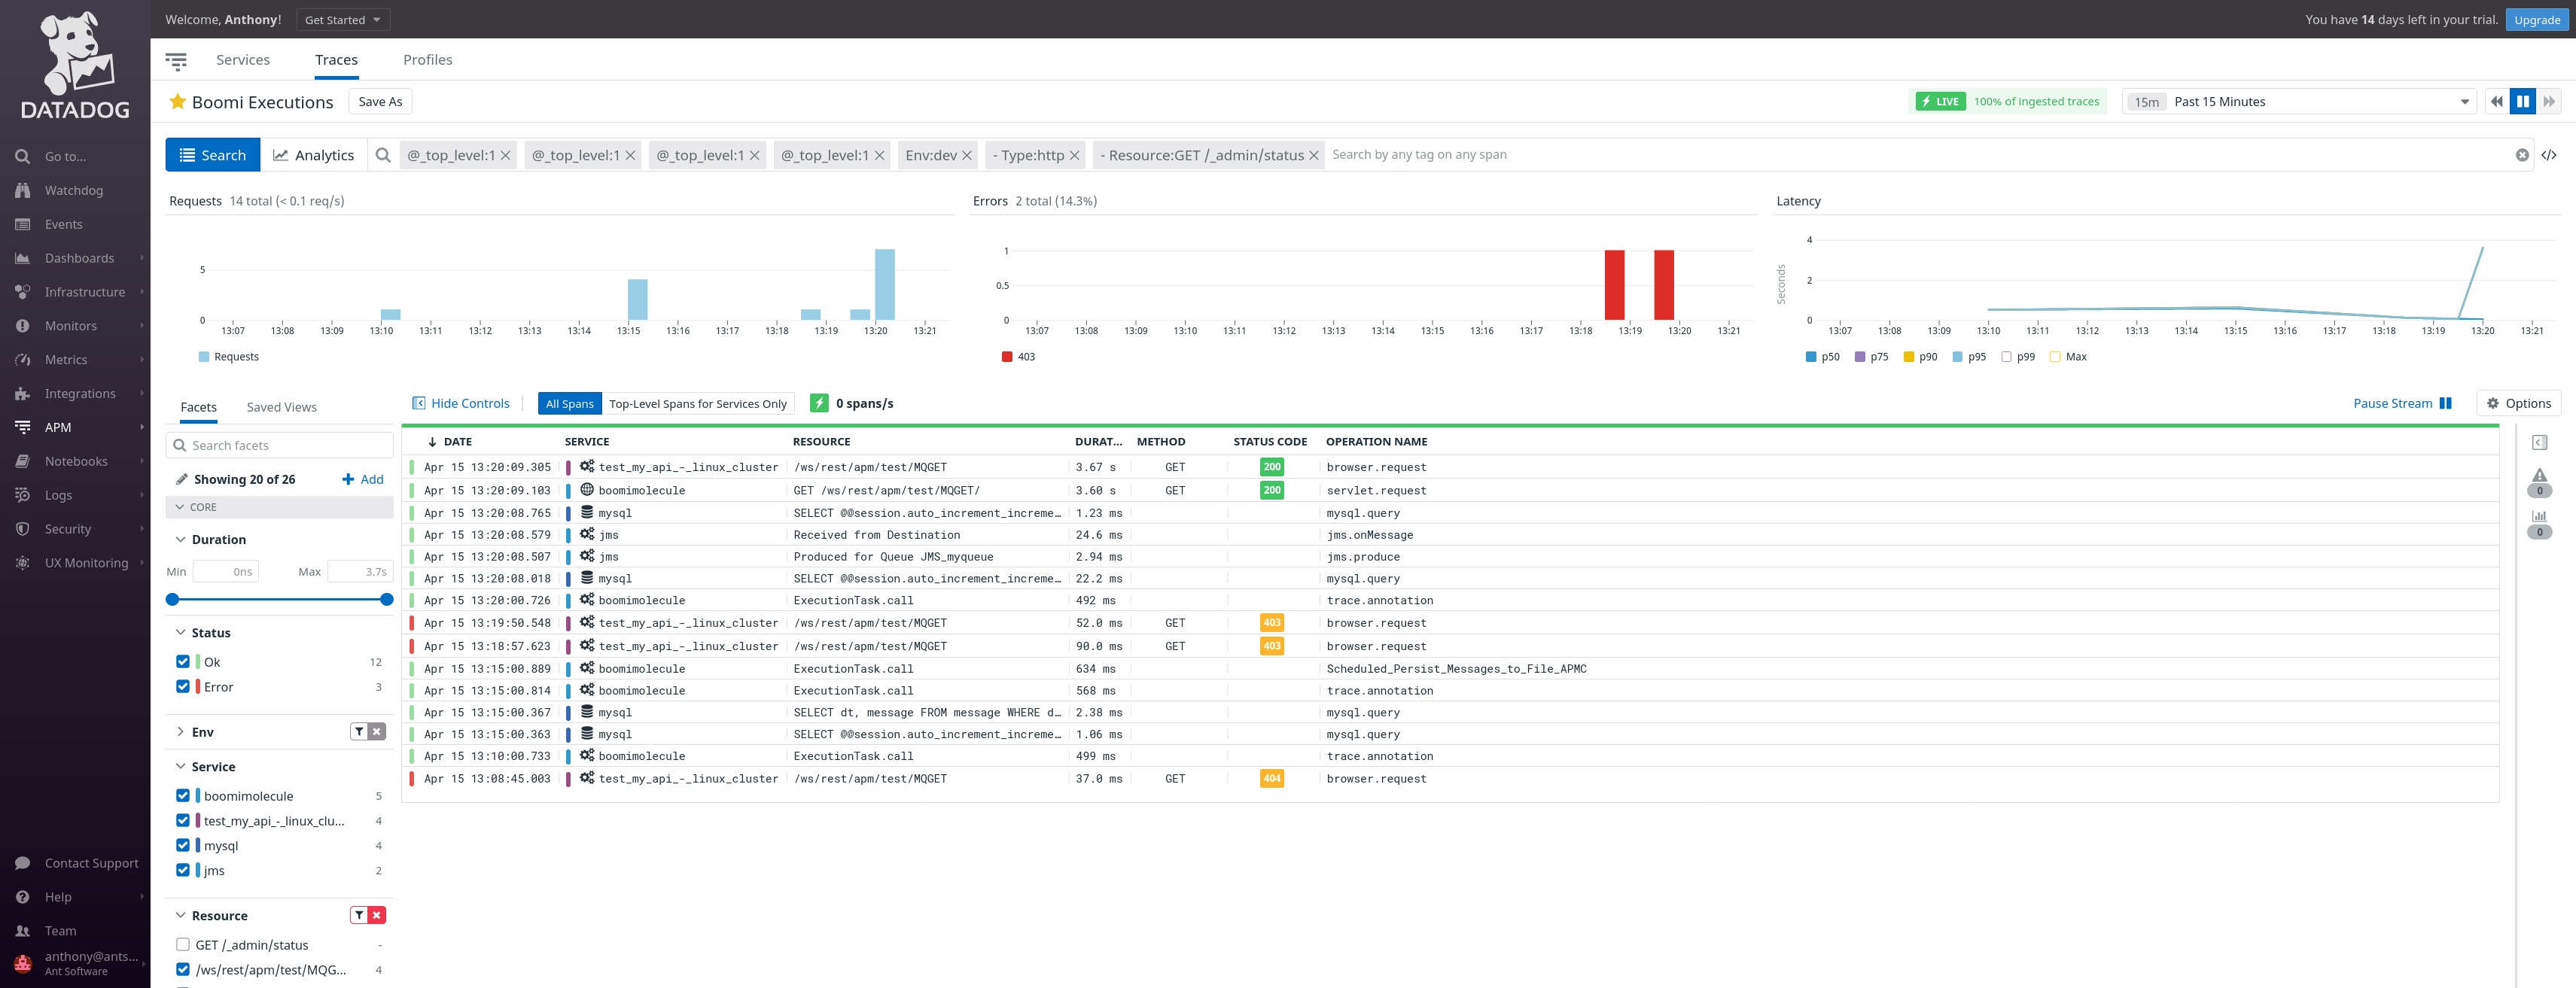
View of Traces
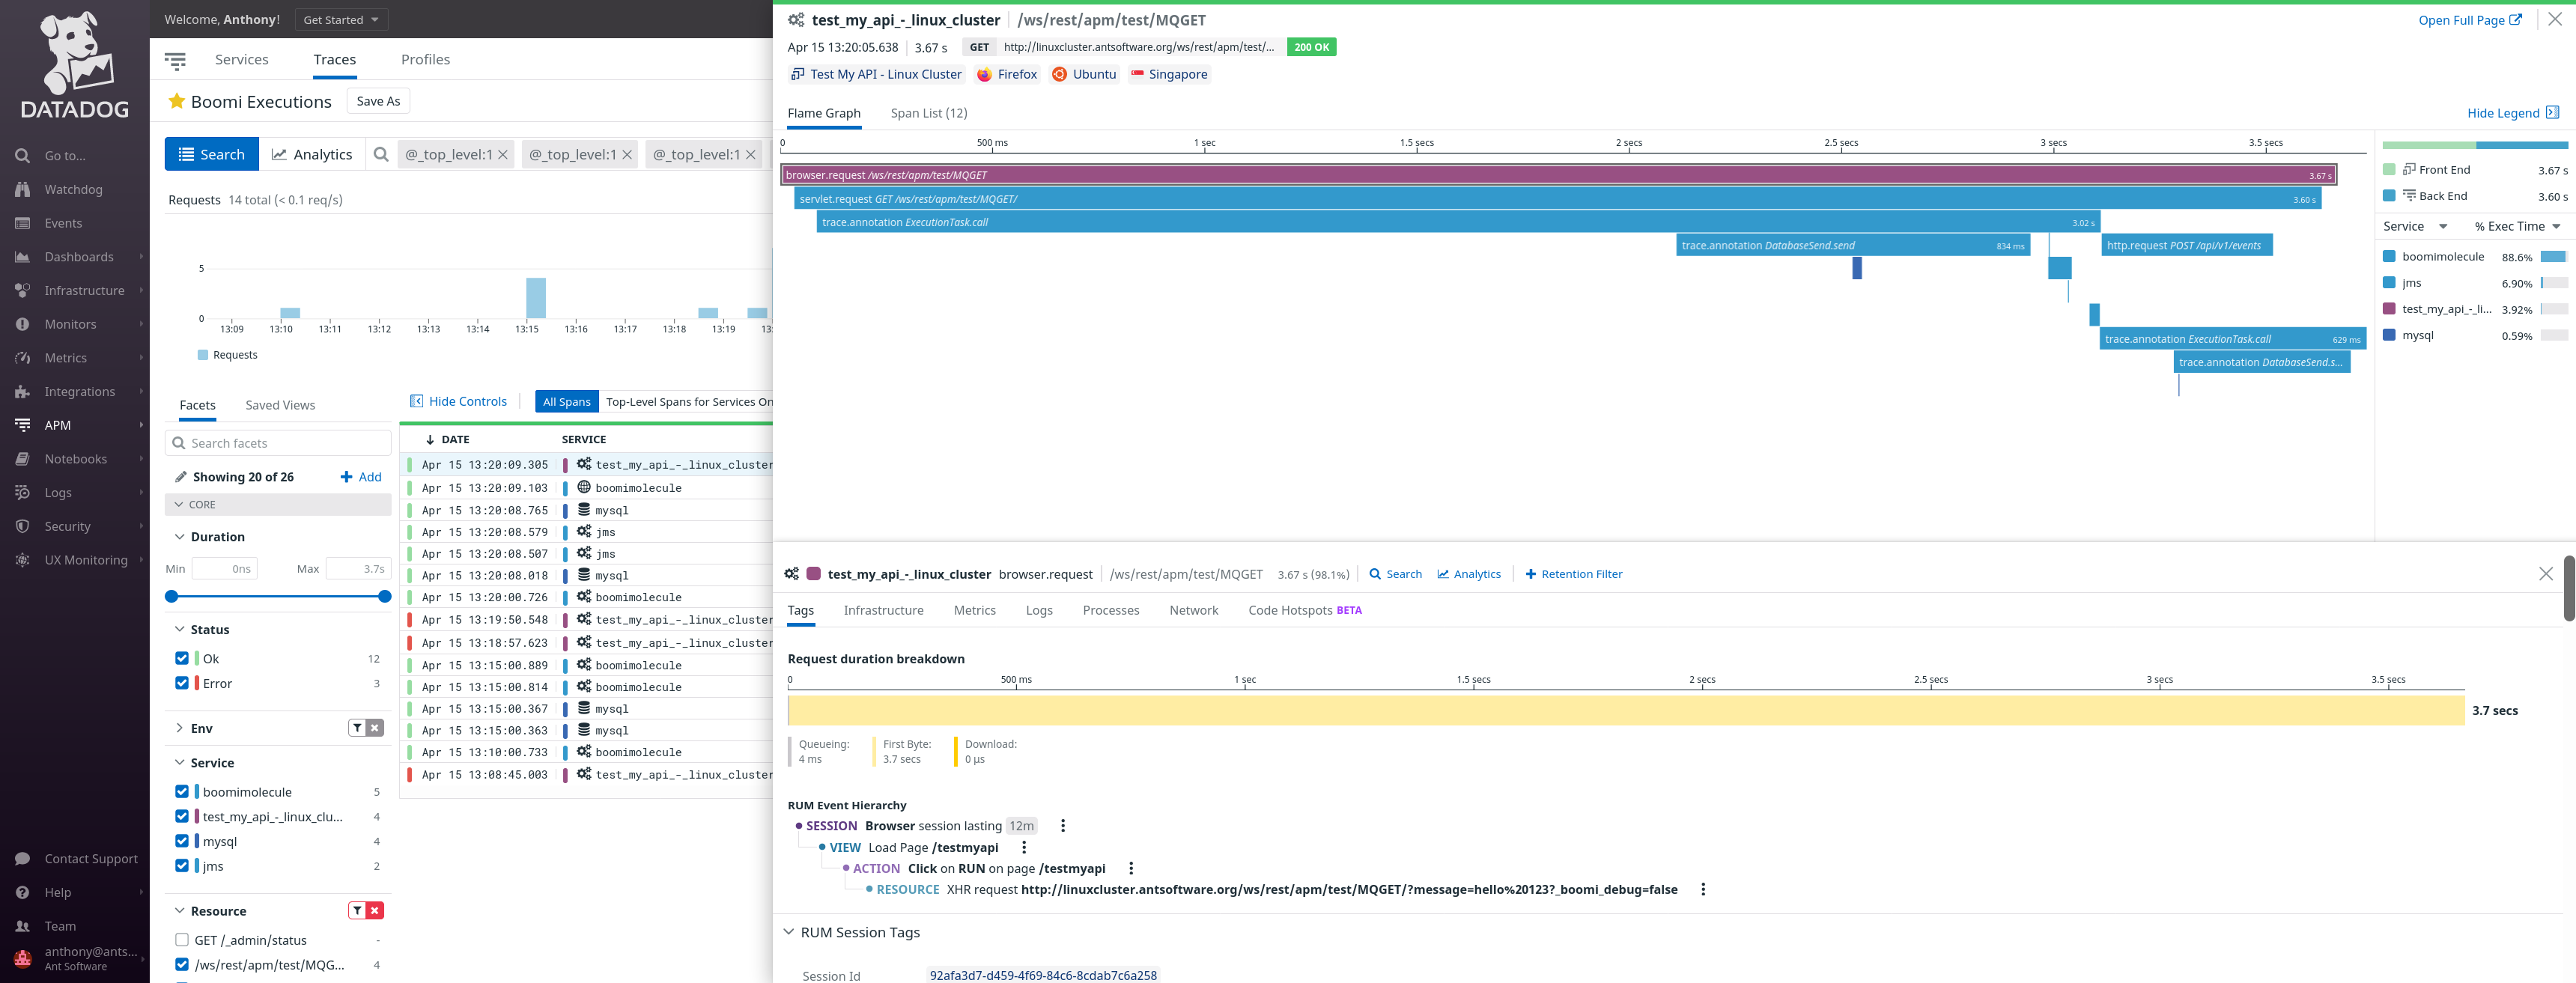
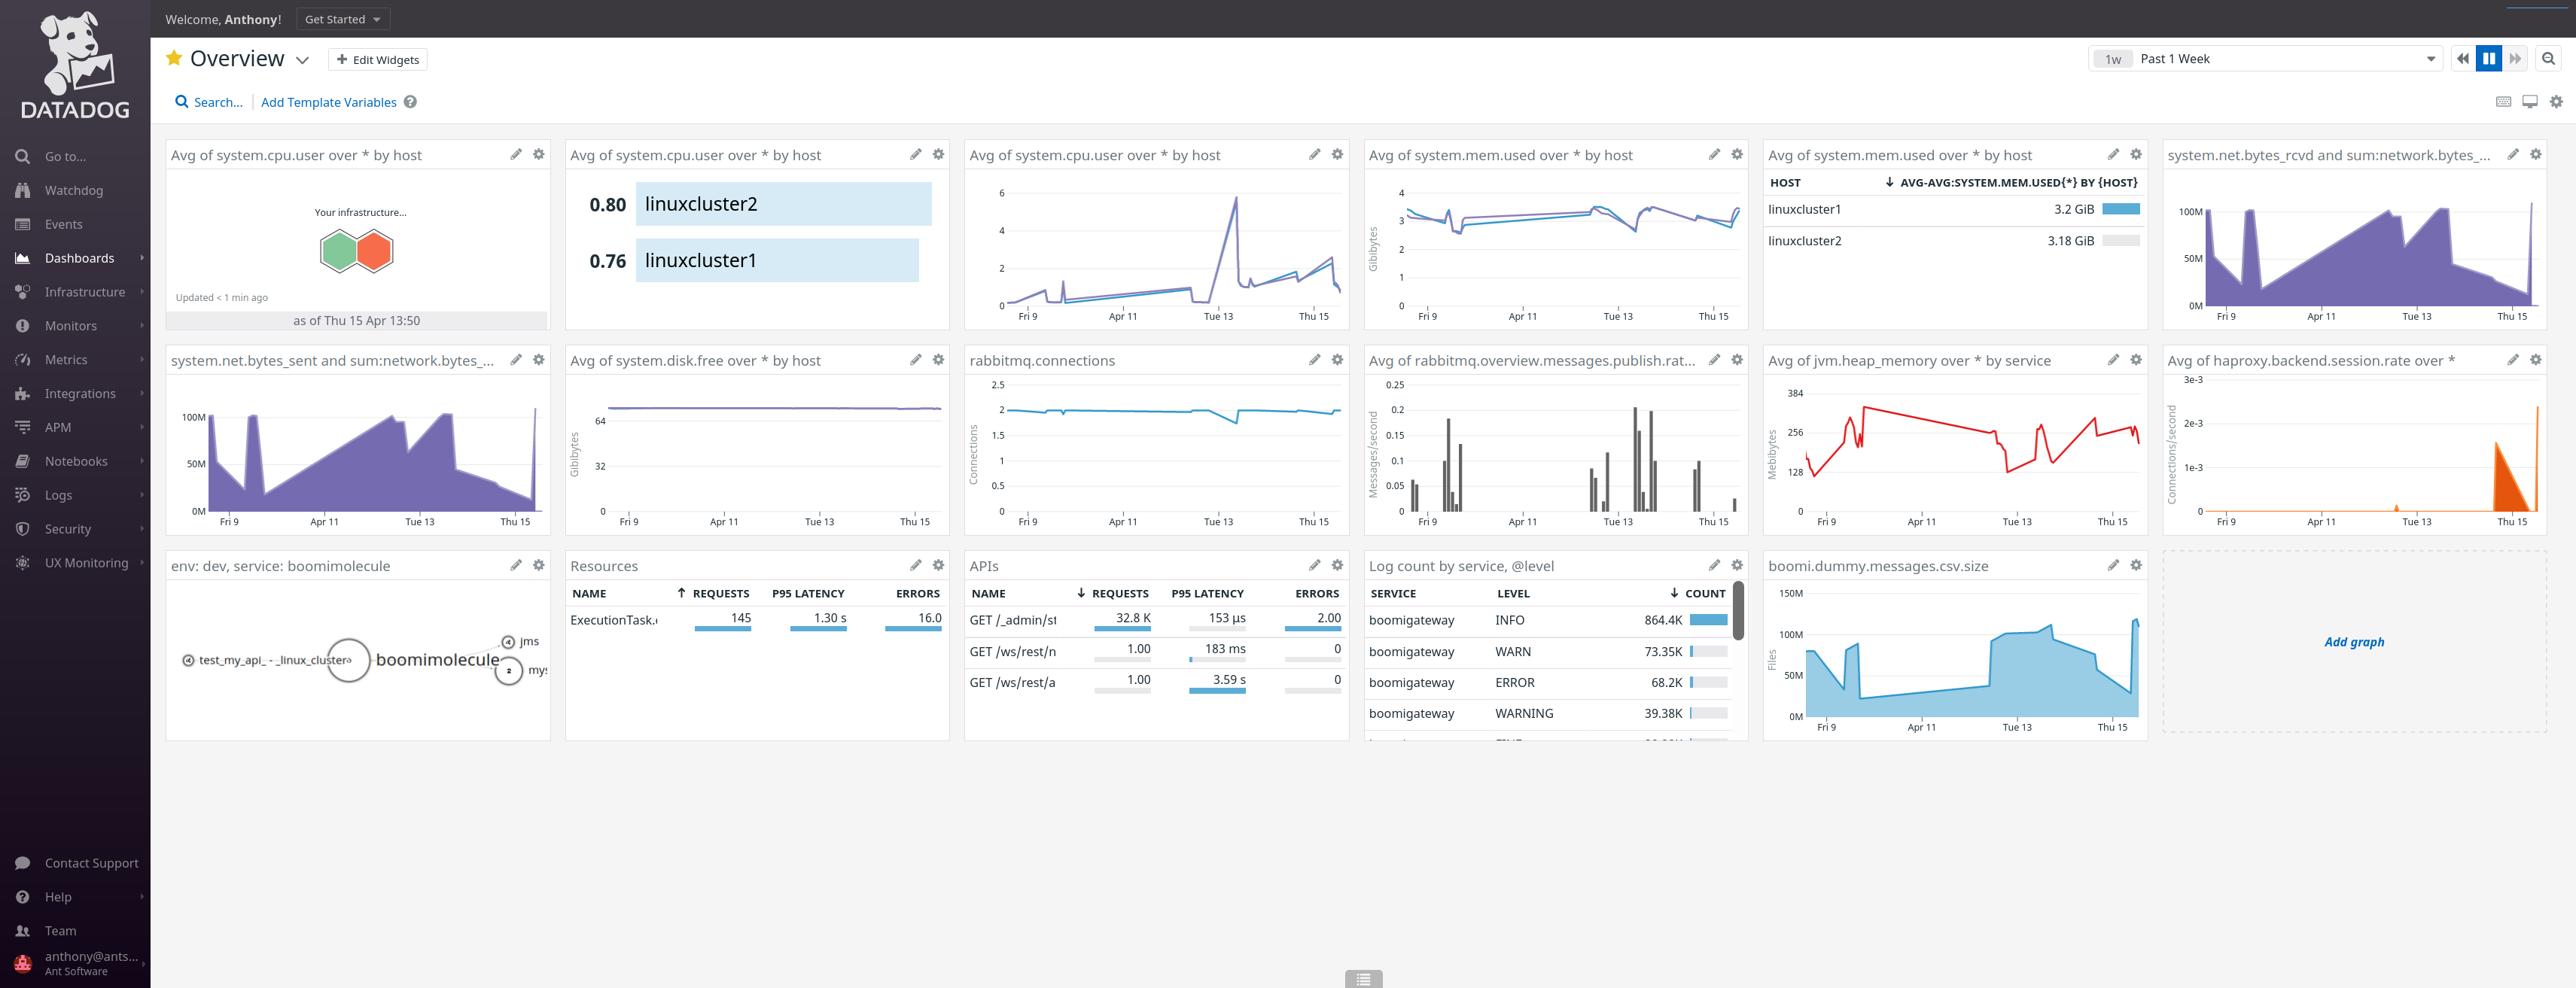
Overview
Details of API Call from Browser to all back-end systems
We have an end-to-end view of the API Call:
- trigger by the browser (instrumented with datadog JavaScript RUM),
- API Call received by the first Boomi process, all the Connectors call involved in the first Boomi process and its SubProcess
- the second Boomi process with a JMS Listener and the Connector involved.
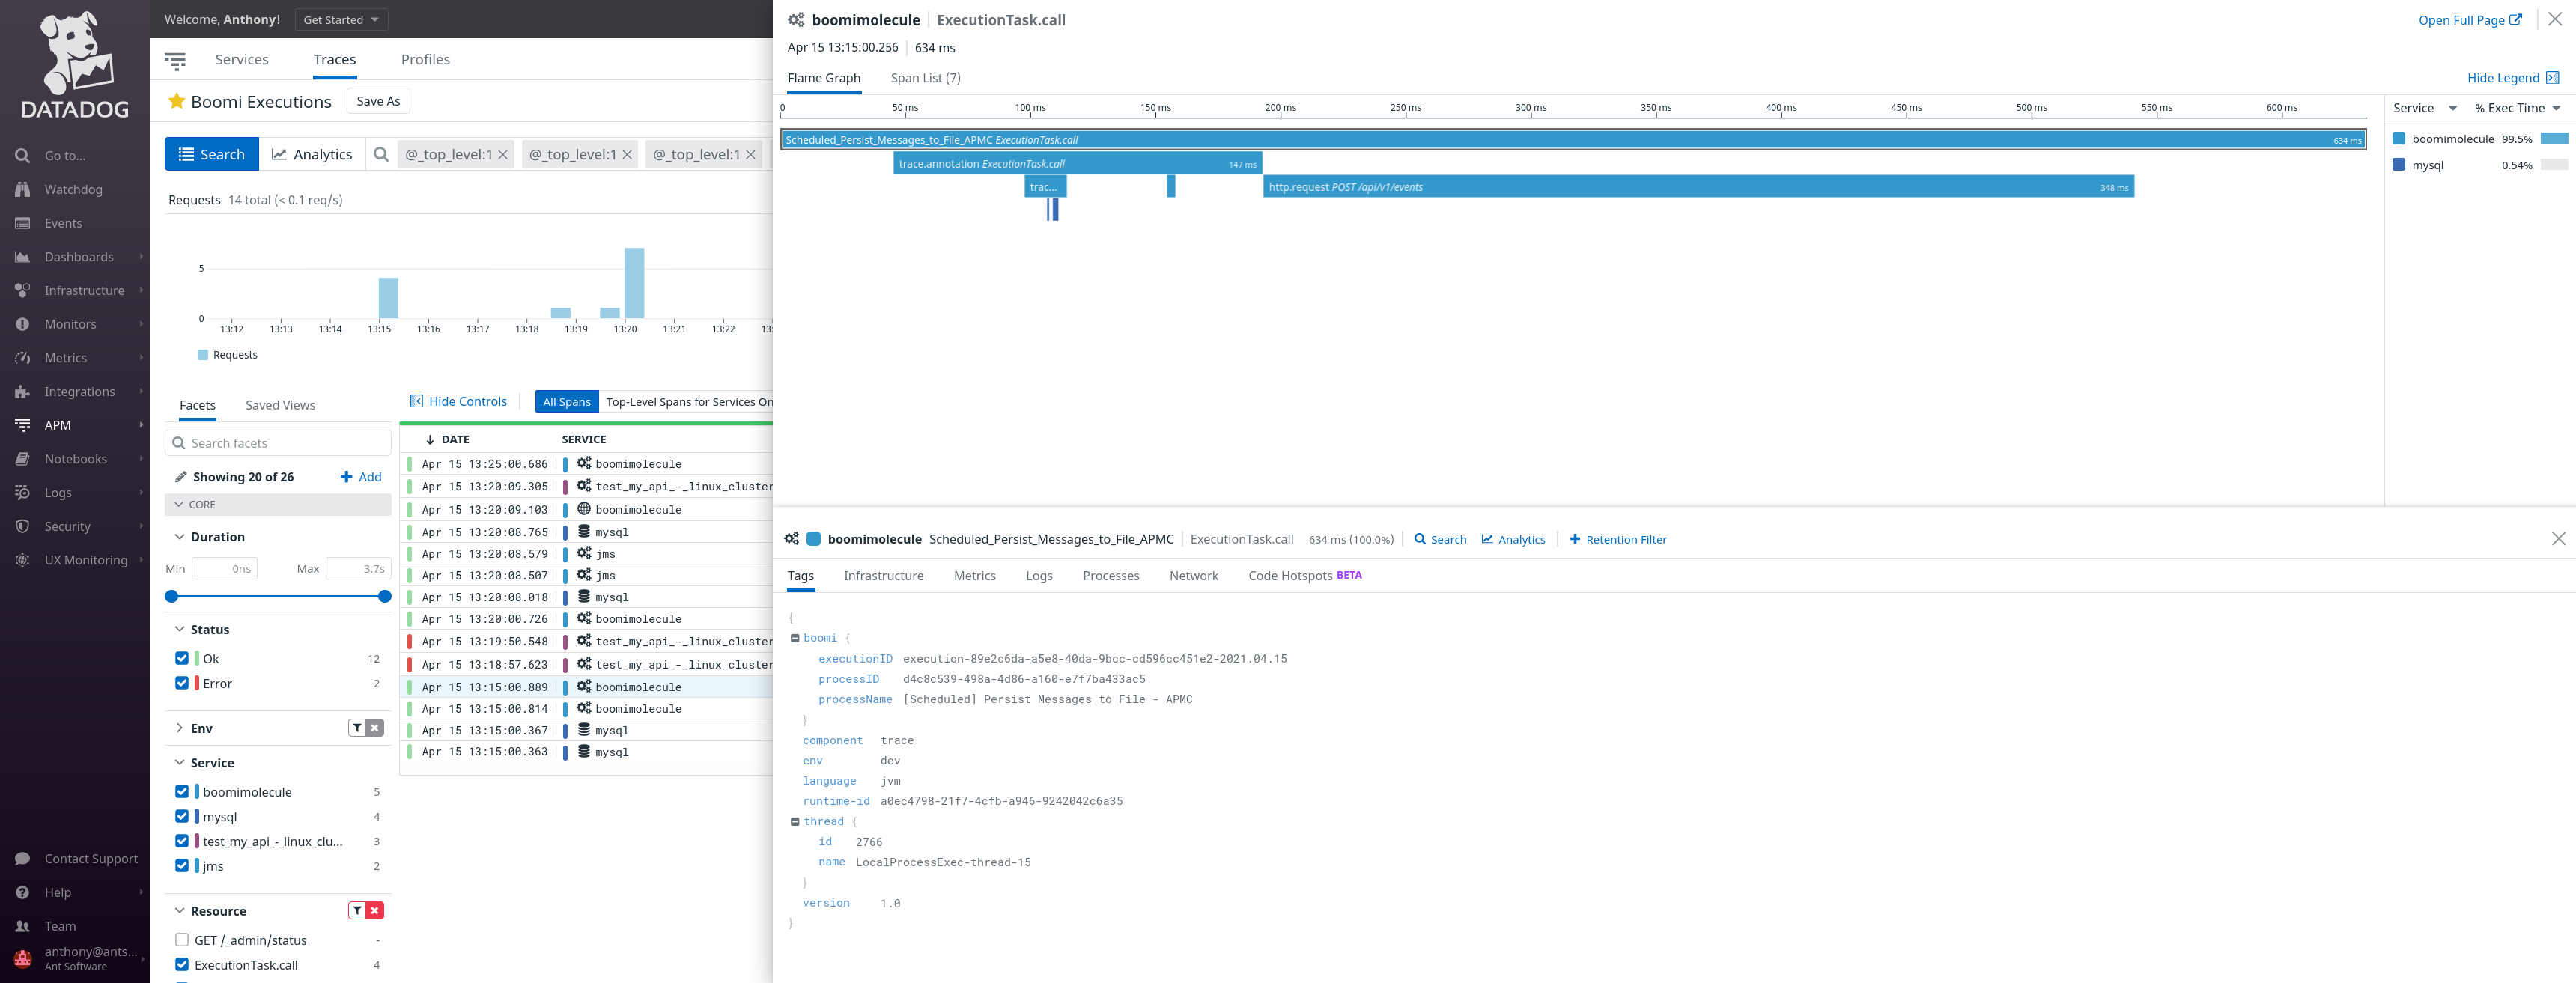
Detail of Scheduled Processes
Please note the presence of the name of the operation which the name of the Boomi Process (in AtomSphere) and the presence of Boomi metadata (boomi executionId, processId and processName) automatically added by the Boomi APM Connector.
View of Events
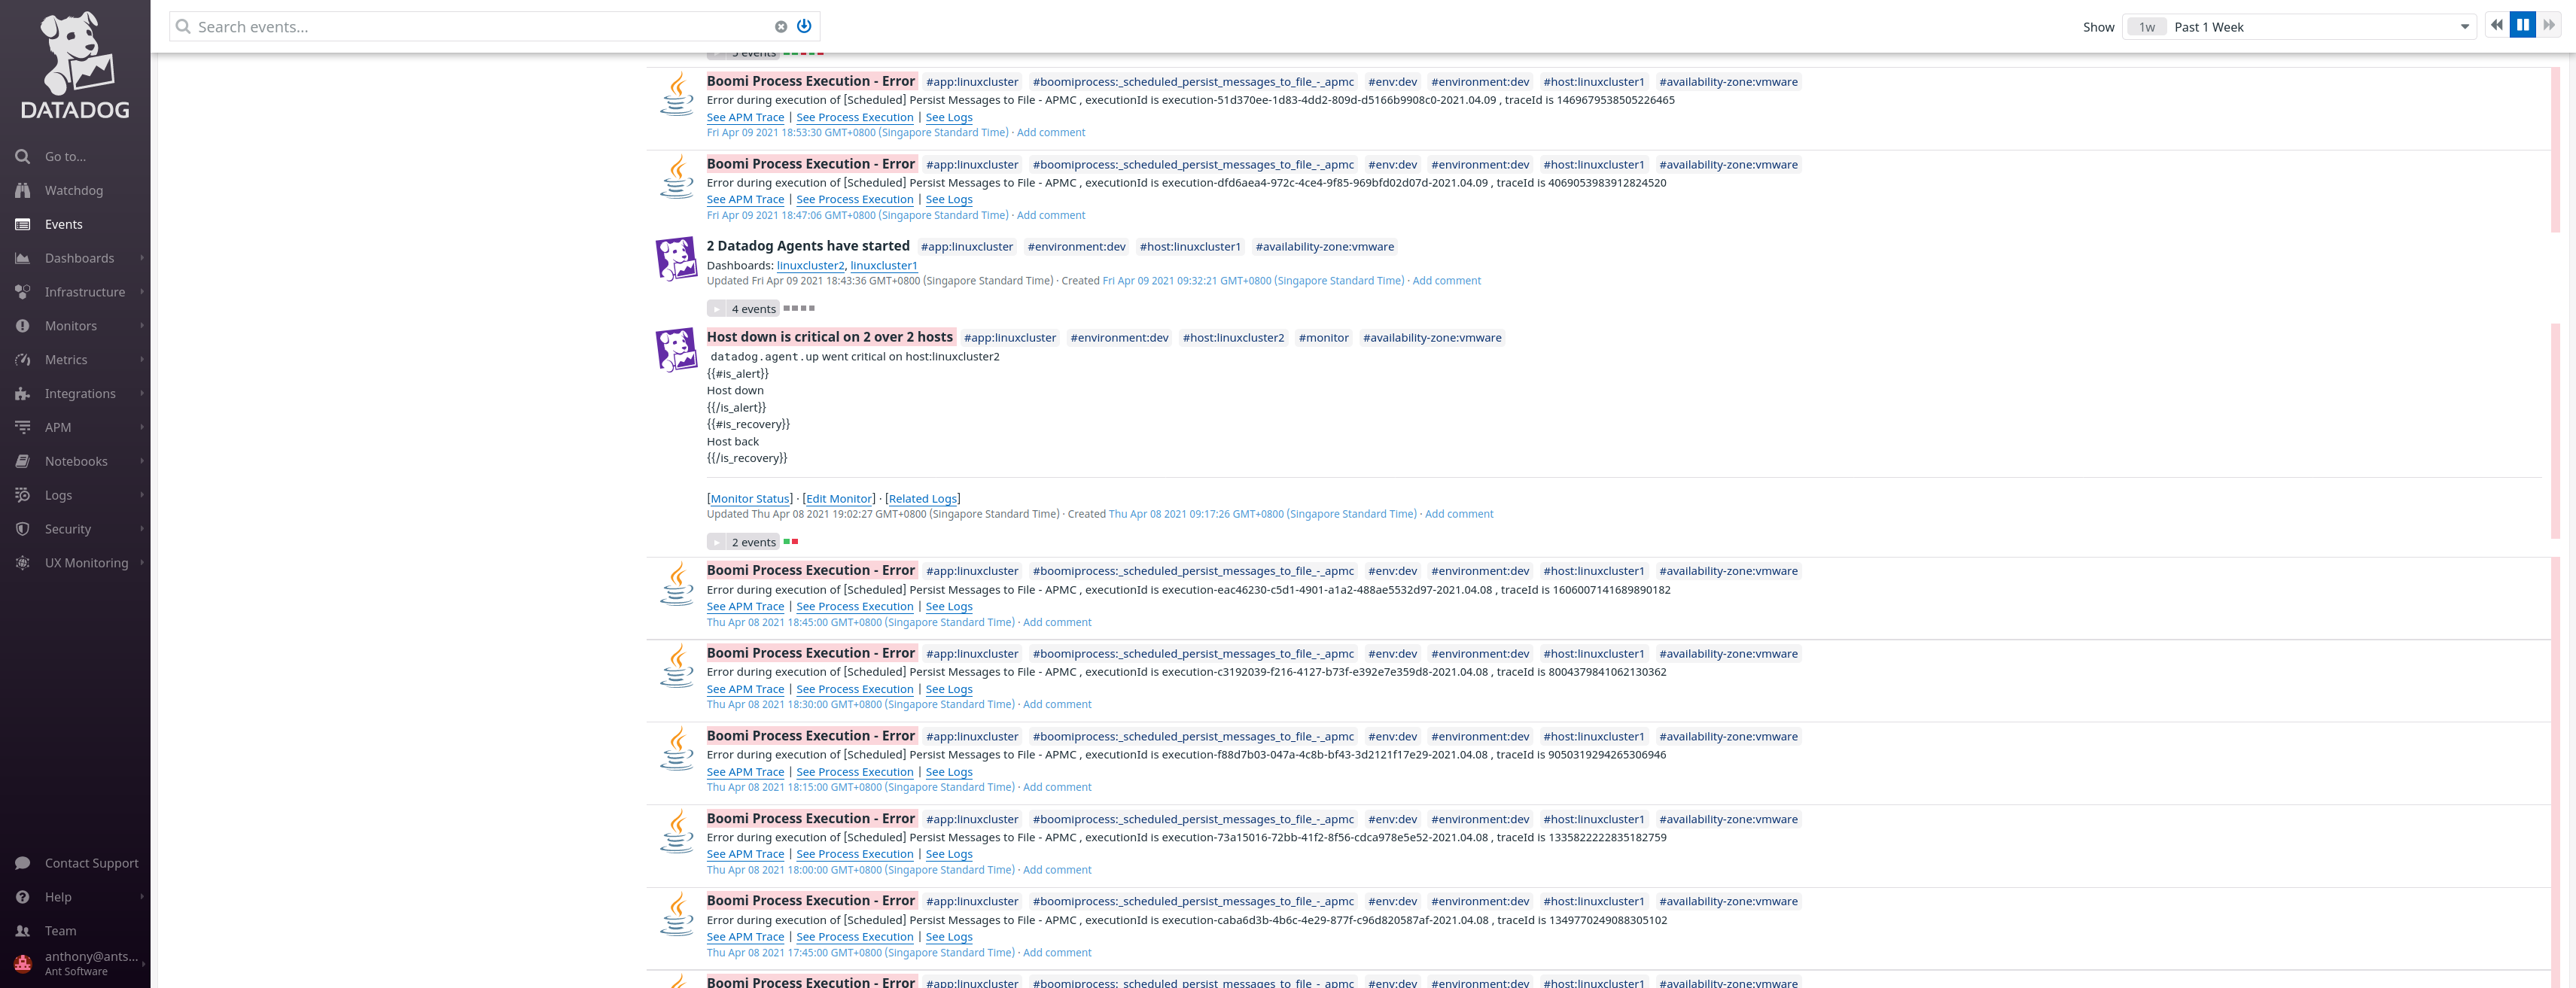
Let’s zoom on an event generated by Boomi APM Connector:
 We can see:
- the high-level details about the event: name of the process, application, environment, host, etc
- the details of the execution: Boomi executionId, traceId
- three links which will help us on the investigation:
- See APM Trace
- See Process Execution
- See Logs
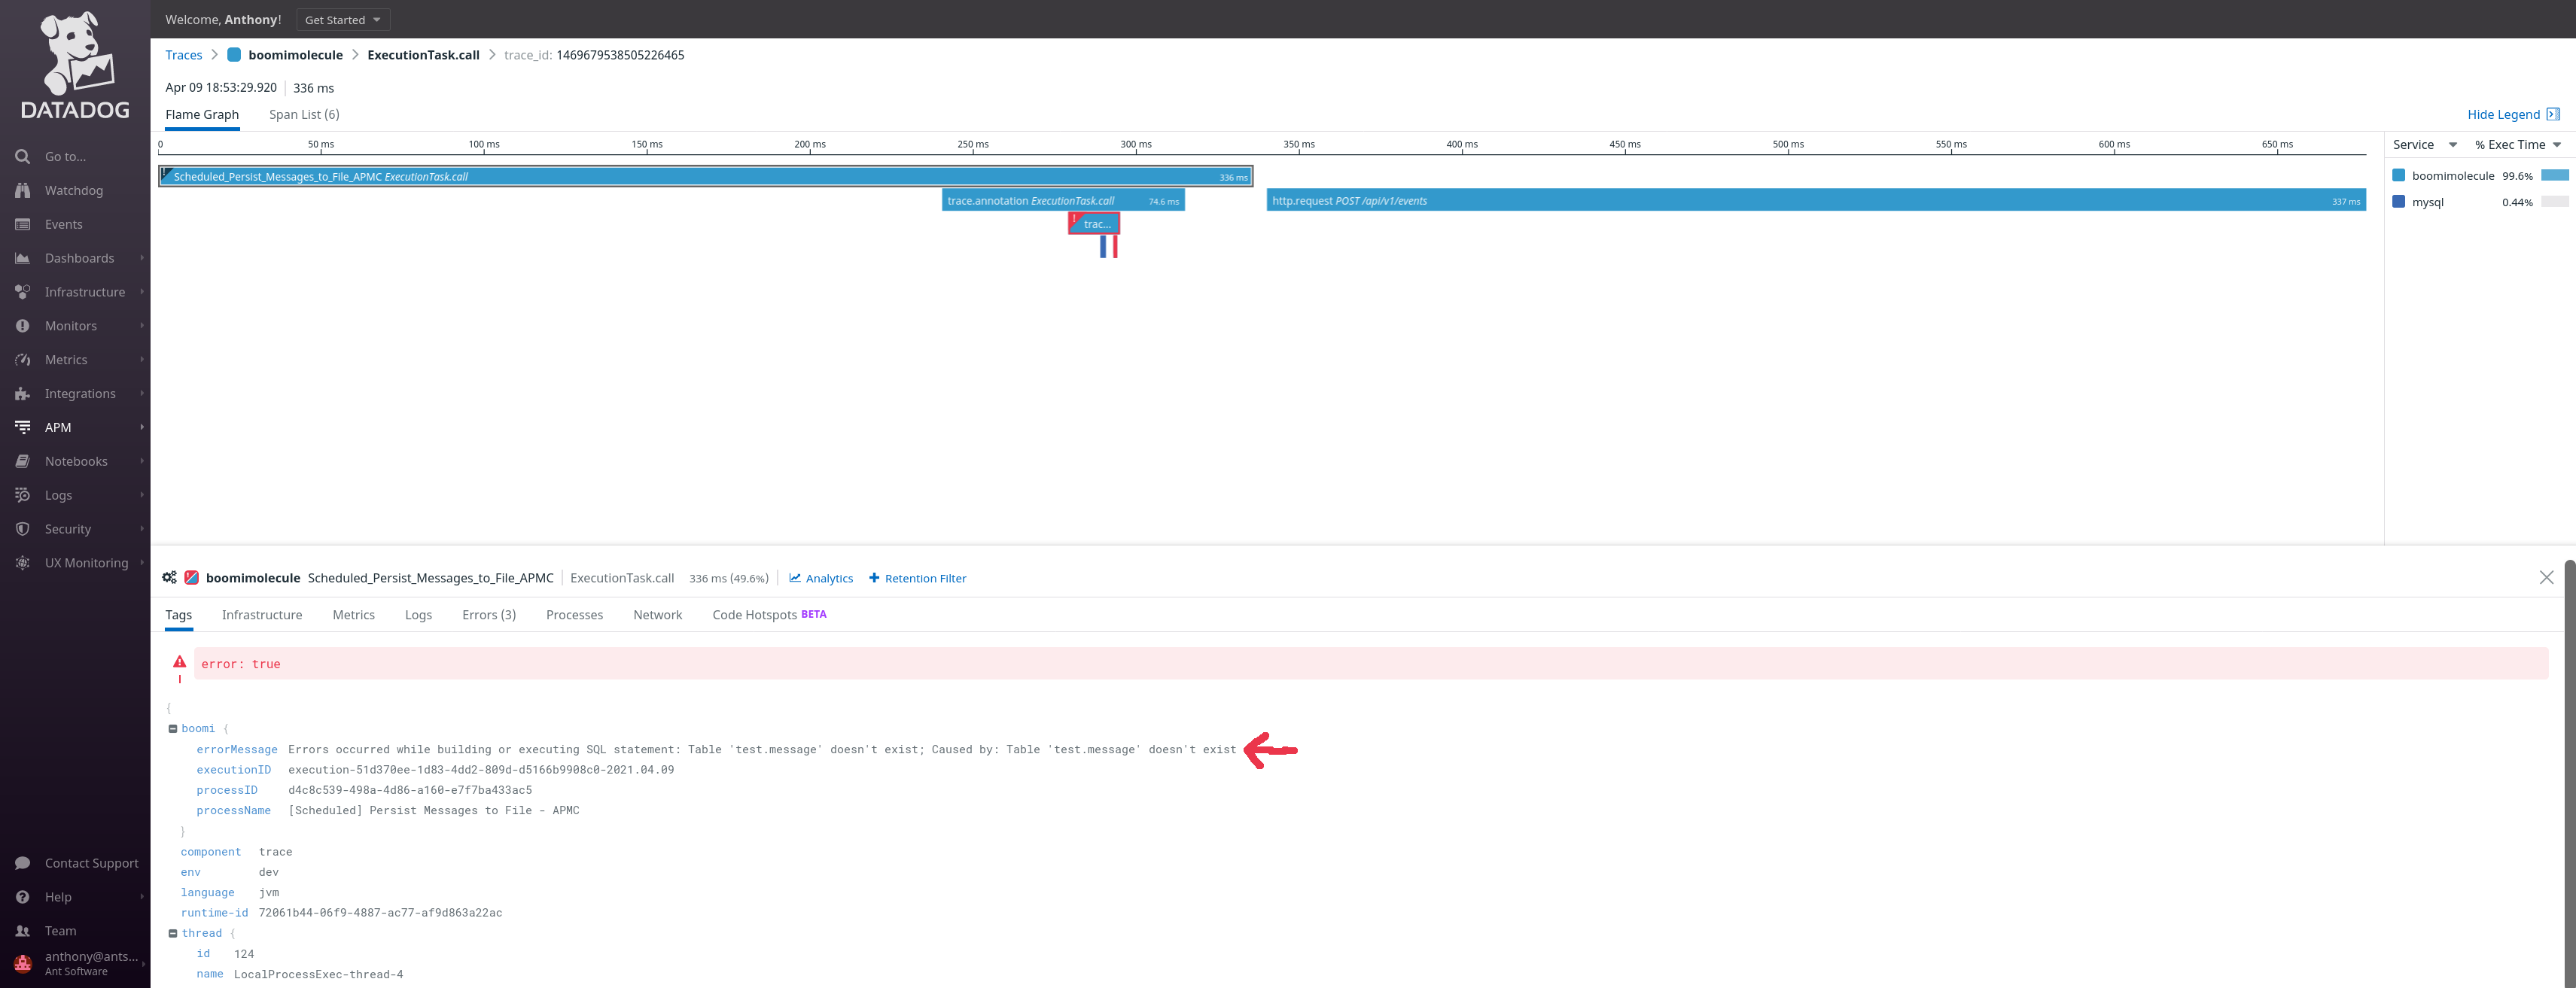
The first link will lead us the Tracing so we can see which steps of the Boomi process failed:
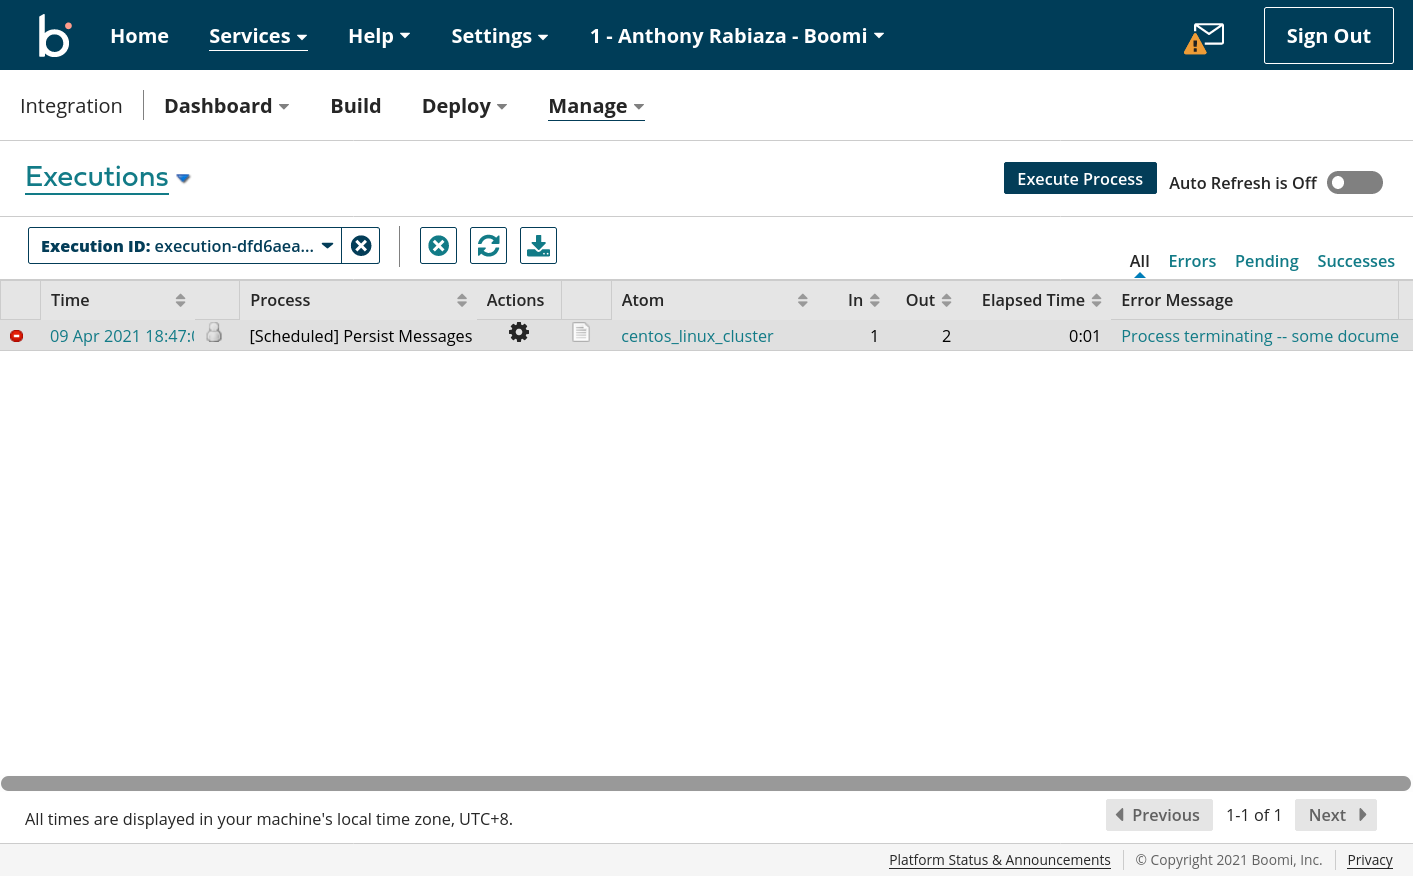
The second link will lead us to Boomi AtomSphere execution so we can see all the details and other metadaaa from Boomi:
The third link will lead us to the logs linked to the environment:
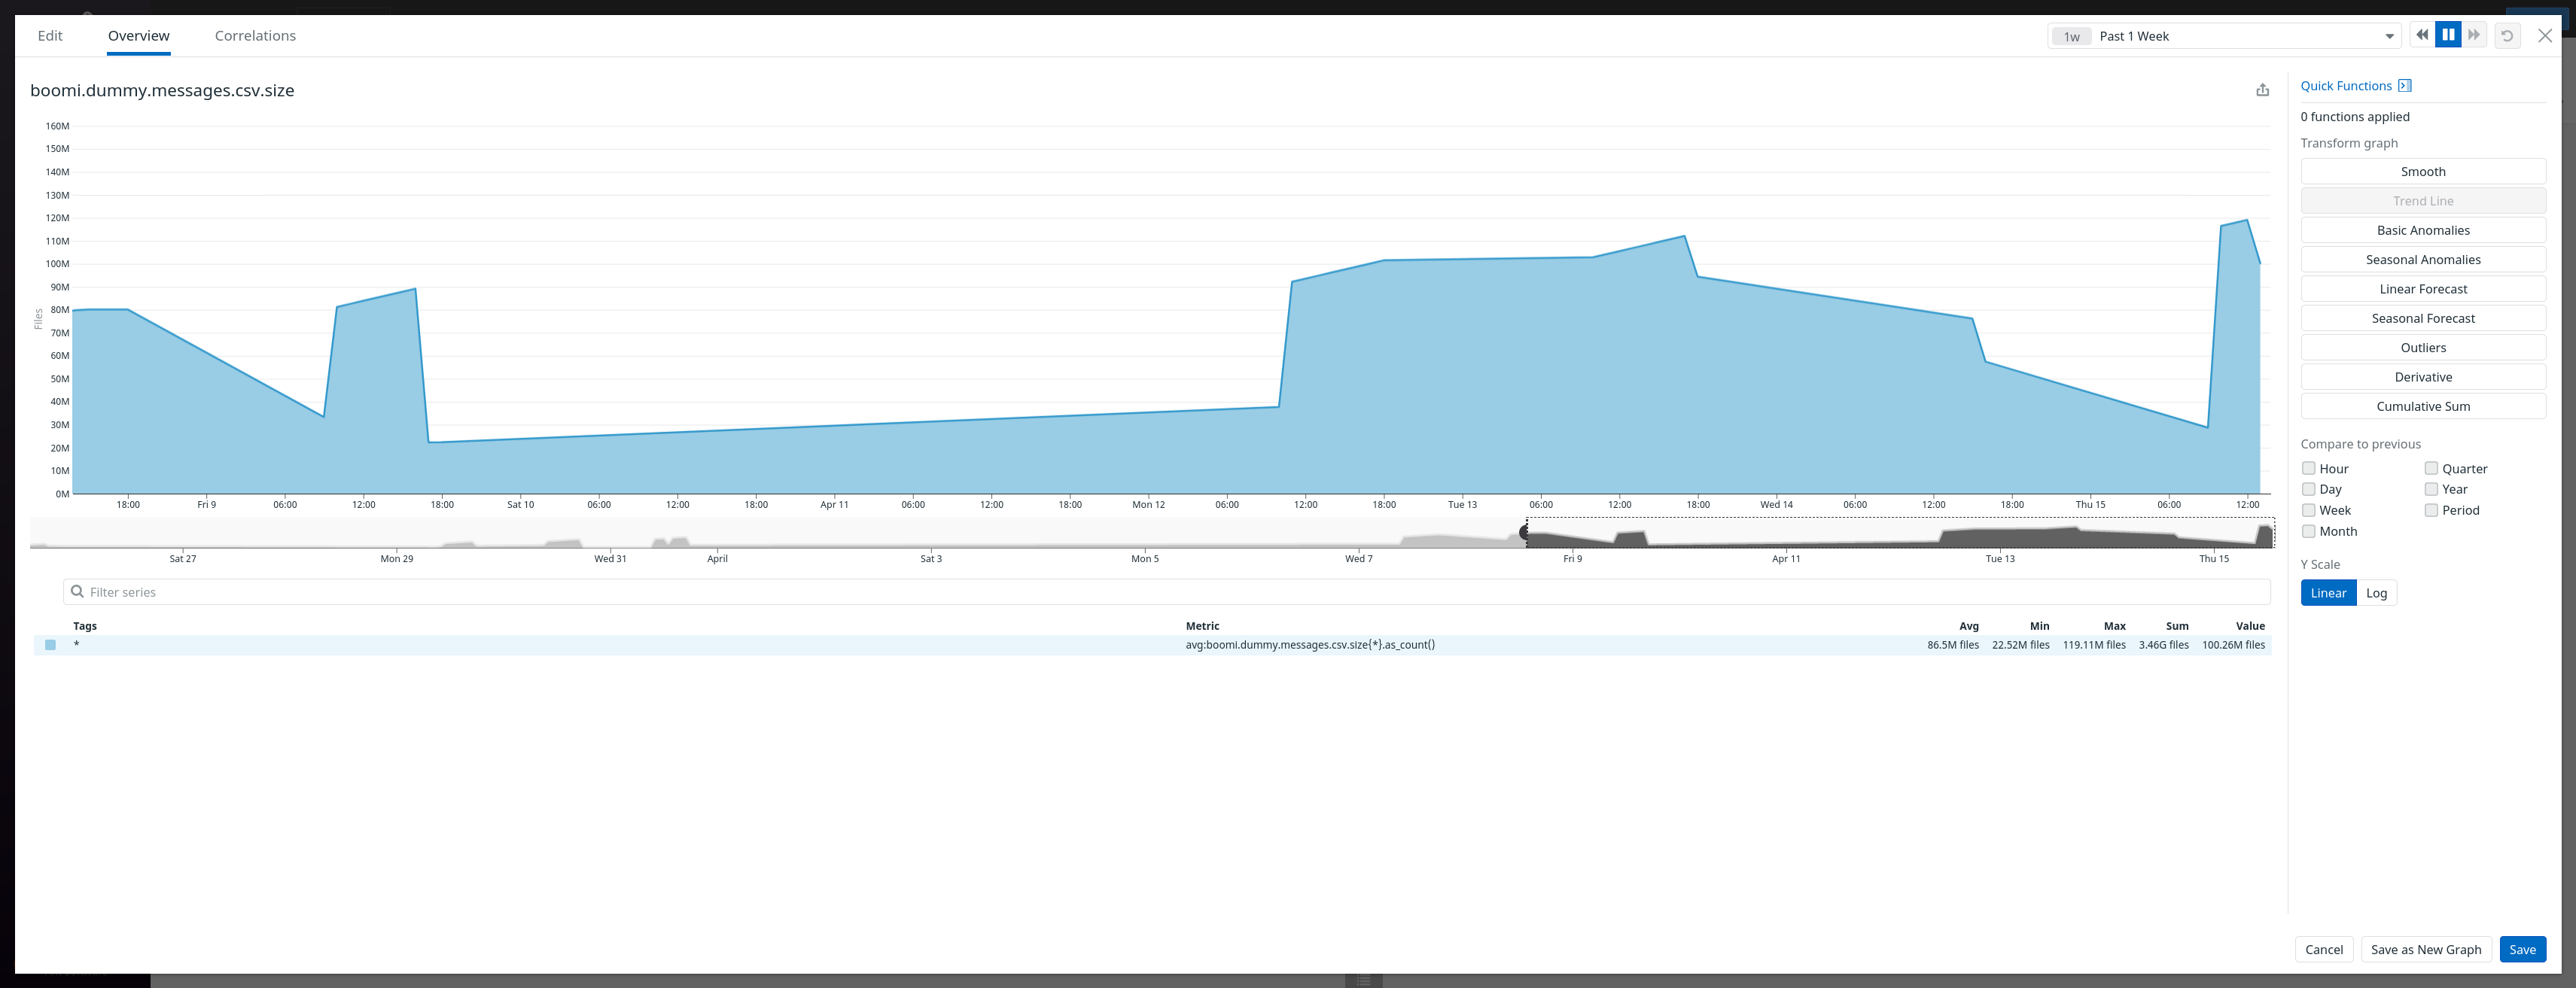
View of Metrics (Custom Metrics collected by Boomi)
This metrics is computed in a Boomi Process which send the data to Datadog using Boomi APM Connector.
And finally, we can create some monitor, synthetics to receive alerts and dashboards:
For more information about Observability with Boomi using other APM Platforms, please have a look at the other pages of this blog: