Boomi Observability with New Relic
Implementation with a Monitoring Platform for Observability with New Relic
Overview
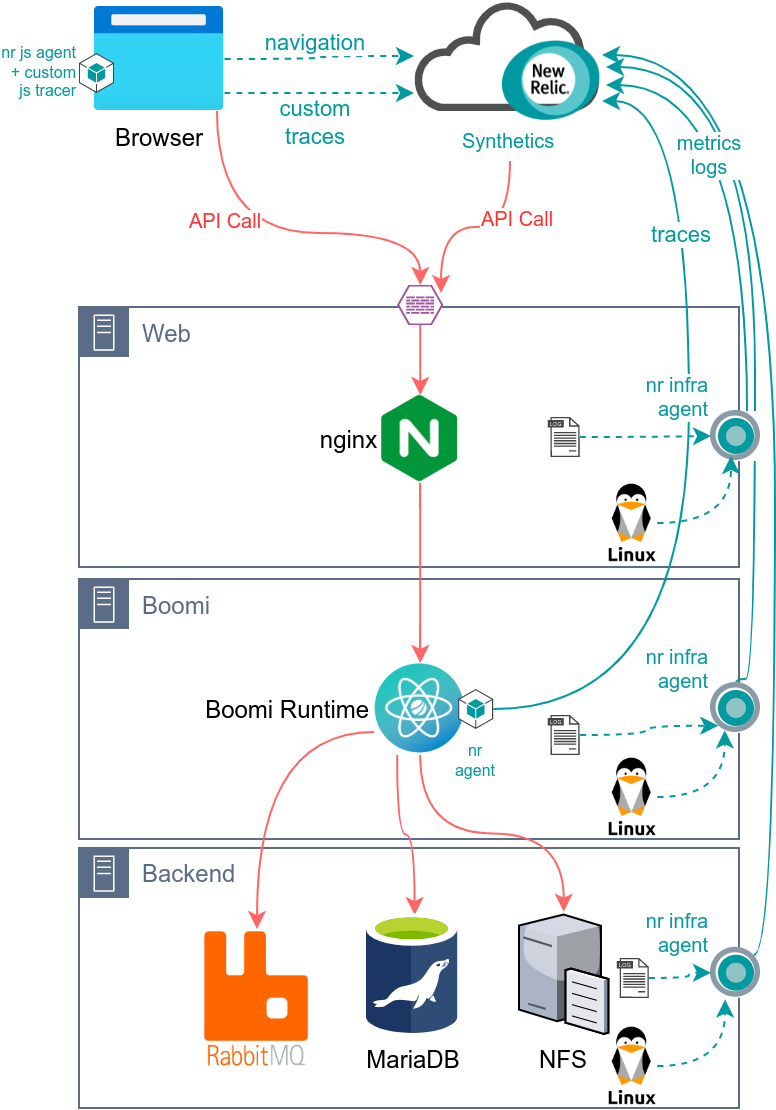
New Relic Infra Agent Installation
The first step consist of installing the New Relic Infra Agent on each server. This step will link the server (or Cloud resource) to New Relic and will allows the gathering of logs, metrics, status of server, processes, network, etc. Please not that this step is optional as the APM is working without the New Relic Infra agent.
Java Agent Installation
The second step consist of installing the Java Agent on each Boomi runtime. This step will link the Java server to New Relic and will allows the gathering of JVM metrics and traces.
APM Setup
The New Relic Java Agent (Jar) needs to be deployed on each node or deployed on the Shared Server accessible by all nodes. Once this is done, Boomi System properties needs to be updated via Boomi AtomSphere:
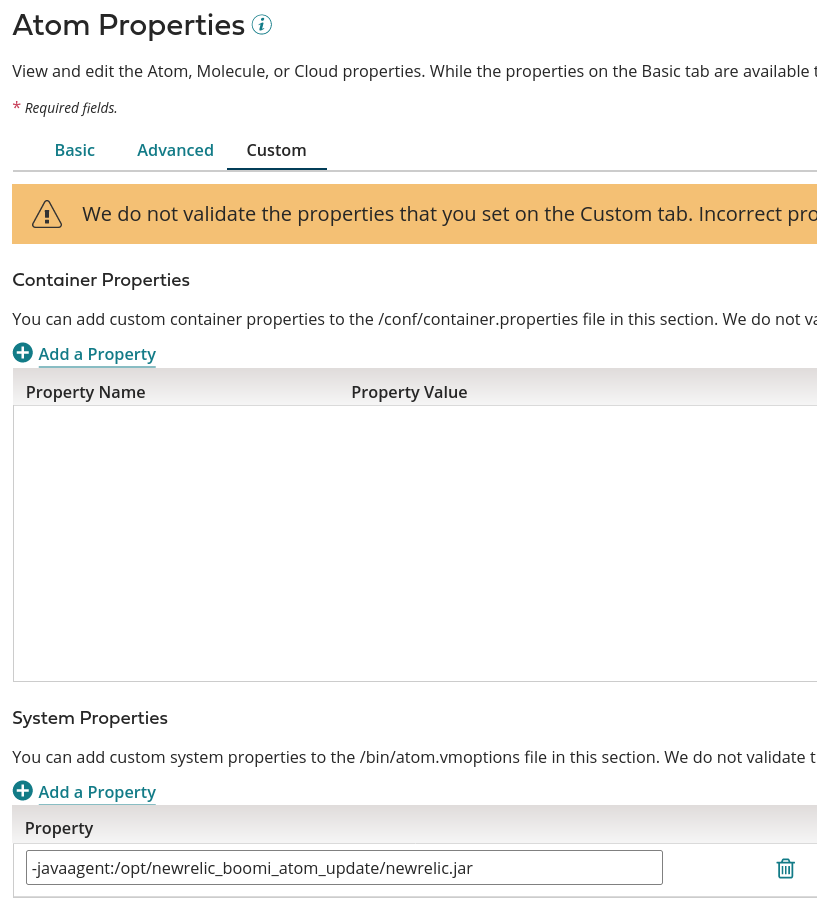
All the other configuration elements will be defined in newrelic.yml (located in the same folder as the Java Agent Jar)
Example of newrelic.yml
common: &default_settings

  license_key: eu01xxyyzz000000001111112222222233333333
  agent_enabled: true
  app_name: Boomi VMWare
  ...
Create a filed called extension-boomi.xml in the extensions folder (from the folder where the Java Agent Jar is located) with the following content:
<?xml version="1.0" encoding="UTF-8"?>
<!-- [email protected] -->
<extension xmlns="https://newrelic.com/docs/java/xsd/v1.0"
	xmlns:xsi="http://www.w3.org/2001/XMLSchema-instance"
	xsi:schemaLocation="newrelic-extension extension.xsd " name="extension-boomi"
	version="1.0" enabled="true">
	<instrumentation>

		<!--Entry Point for all Executions-->
		<pointcut transactionStartPoint="true">
			<className>com.boomi.execution.ExecutionTask</className>
			<method>
				<name>call</name>
			</method>
		</pointcut>
		<!--Removing StatusServlet Trace which is appering every second-->
		<pointcut transactionStartPoint="false" excludeFromTransactionTrace="true" ignoreTransaction="true">
			<nameTransaction />
			<className>com.boomi.connector.server.http.StatusServlet</className>
			<method>
				<name>doGet</name>
			</method>
		</pointcut>

	</instrumentation>
</extension>
APM Configuration: Tracing and Custom Data Collector
Boomi Custom Library
- For instrumentation, you need to download the API archive from New Relic: for instance newrelic-api-6.4.2.jar
- Upload the Jar to Boomi>Settings>Account Libraries
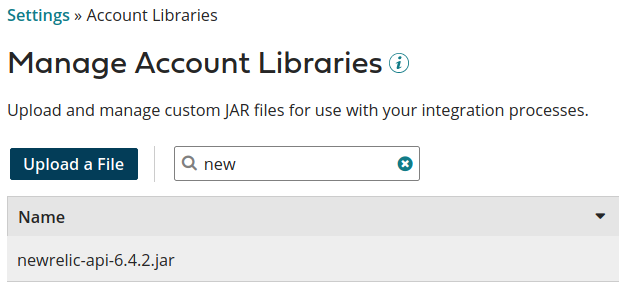
- Create a Custom Library and Deploy it to the Environment which will be monitored by New Relic

Boomi Scheduled Processes
The Boomi Scheduled processes will be detected by New Relic APM but requires a manual instrumentation using Boomi APM Connector to add the tracing metadata:
Initial process:

The updated process will looks like the following:

The changes includes:
- The APM Start shape at the beginning
- The APM Stop shape before the last End, please note that we created a branch here as the Disk shape (Get) might not returned a Document thus an APM Stop shape after the Disk might not be called
- The APM Error in the try catch
The Boomi APM Connector will allow the Instrumentation of any Boomi Processes and will provide with 3 steps: Start, Stop or Error
Boomi API Processes
In the context of New Relic, the Boomi API processes also require manual instrumentation using the Boomi APM Connector.
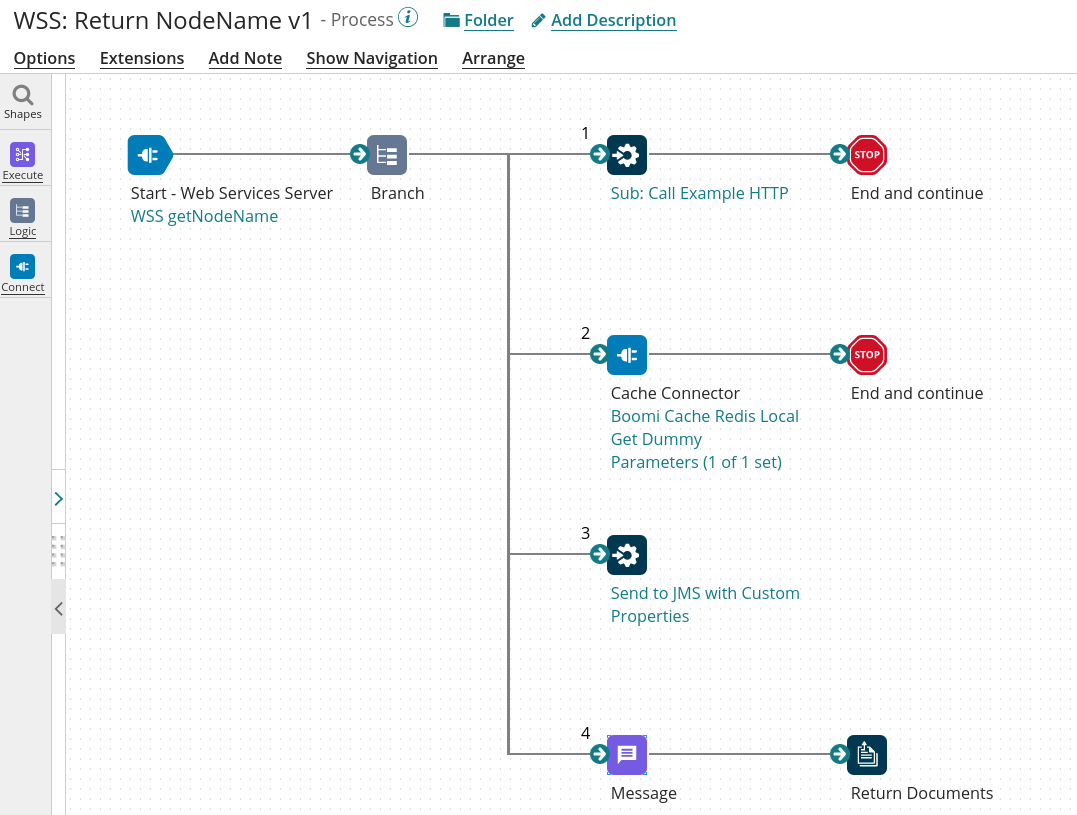
Boomi API before changes:
Boomi API after changes:
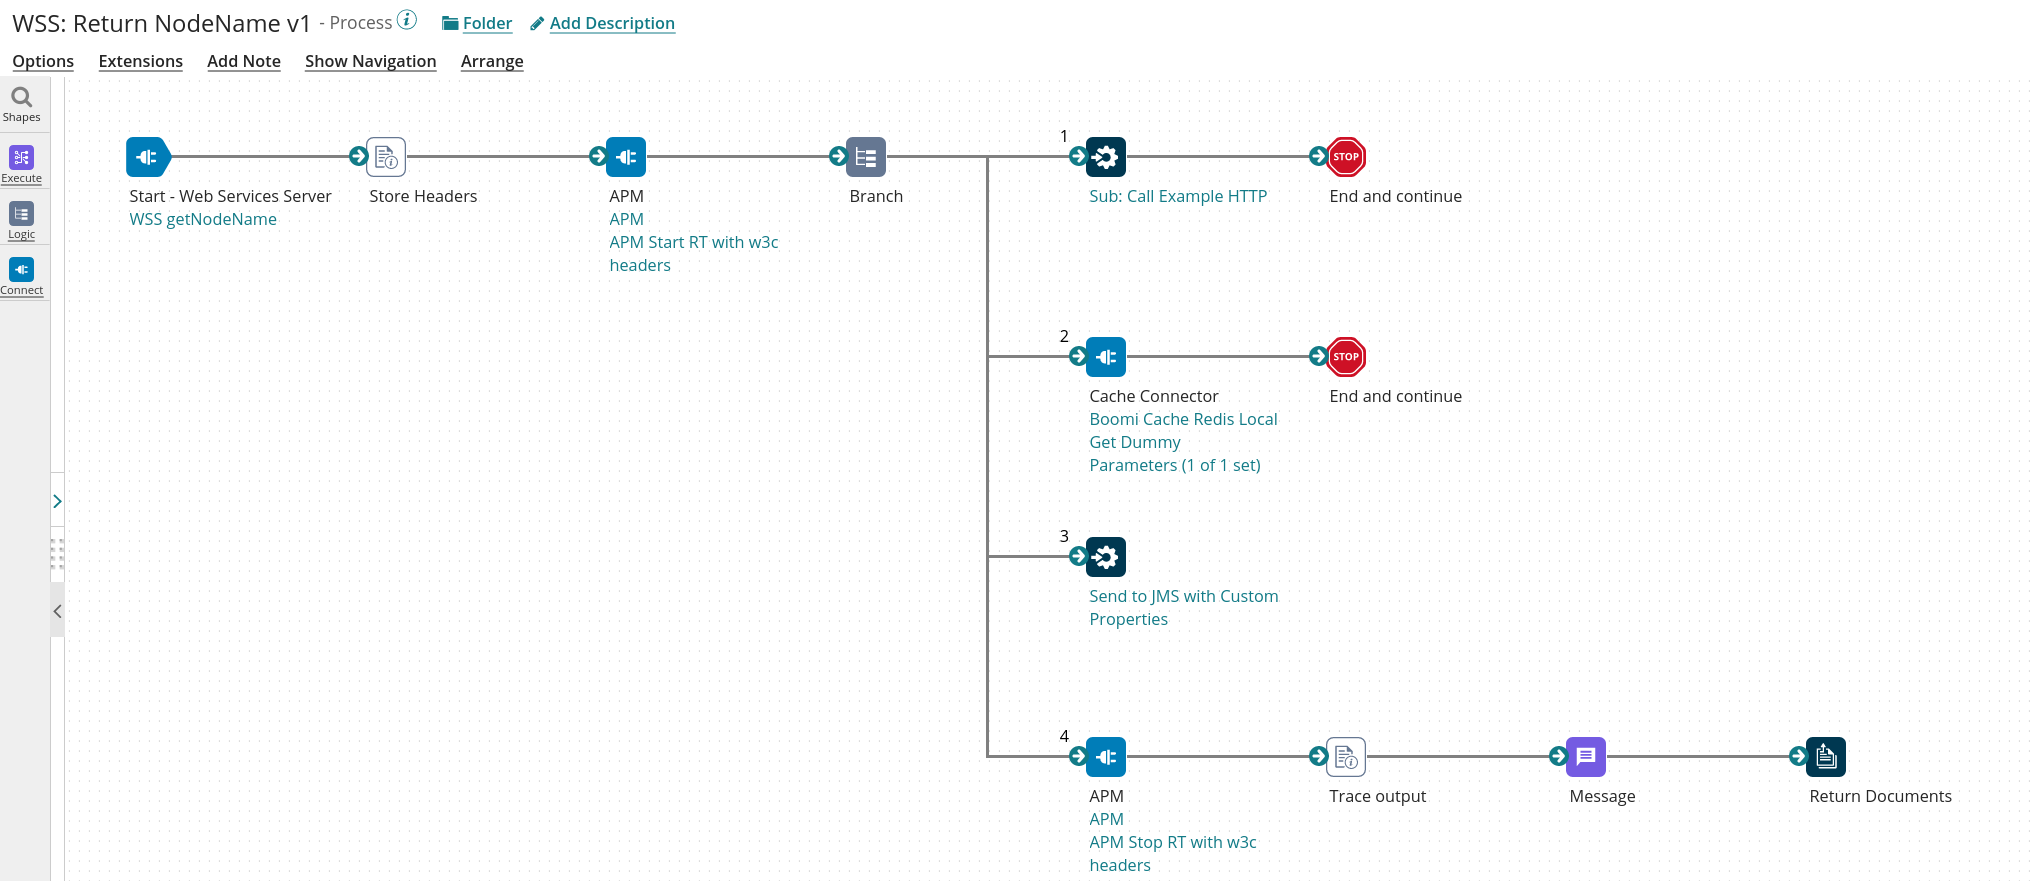
The changes are similar to the changes done in Scheduled Process except that the APM Operations are using different configuration:
- For a Start Operation:
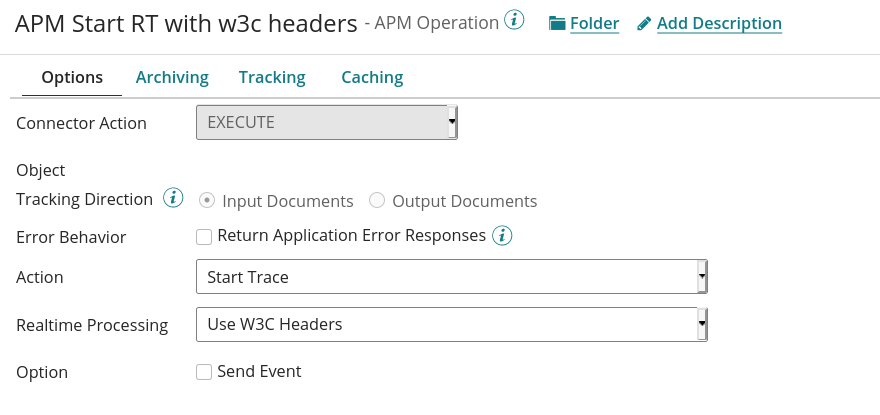
The Operation will use the the HTTP W3C Headers send by the API Consumer to correlate the context with current one.
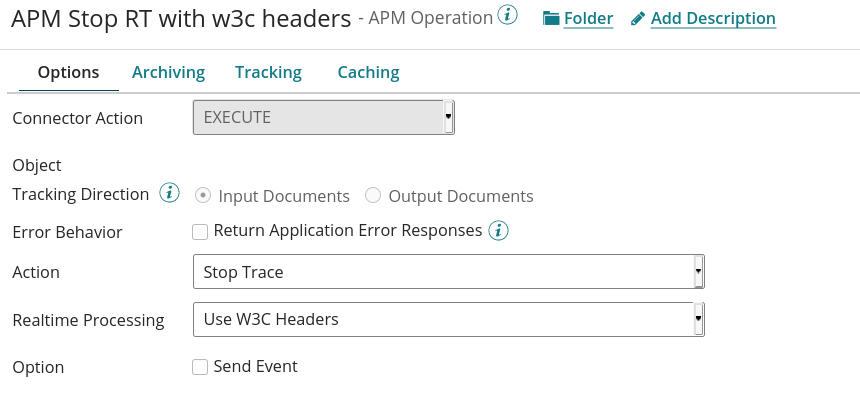
- For a Stop Operation:
Boomi JMS Processes
In the context of New Relic, the Boomi API processes require a similar manual instrumentation as the API Process. You can also use the same APM Operation as they are working in the context of API and JMS Processes.
Boomi JMS Process before changes:
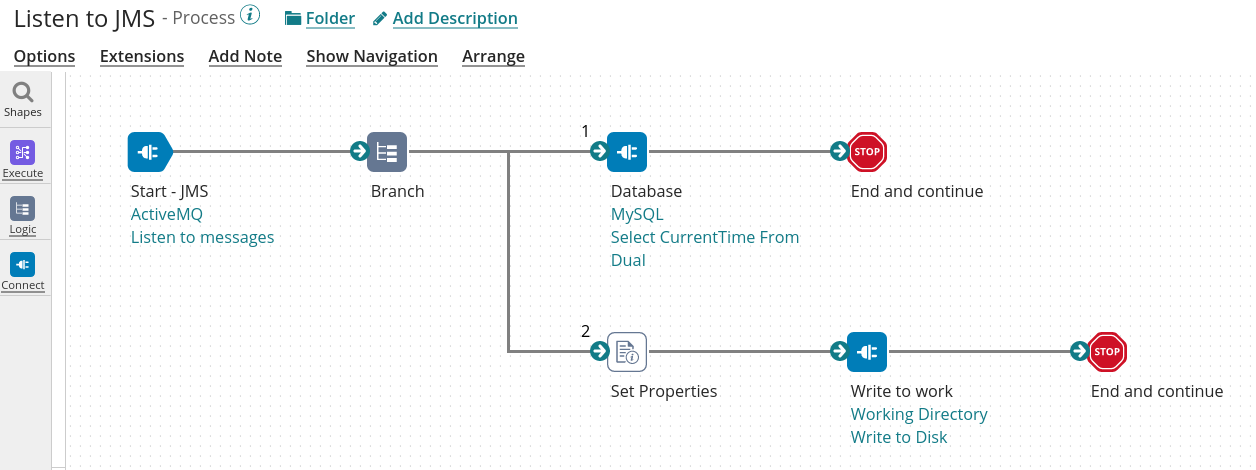
Boomi JMS ProcessI after changes:

Review of the Observability with New Relic
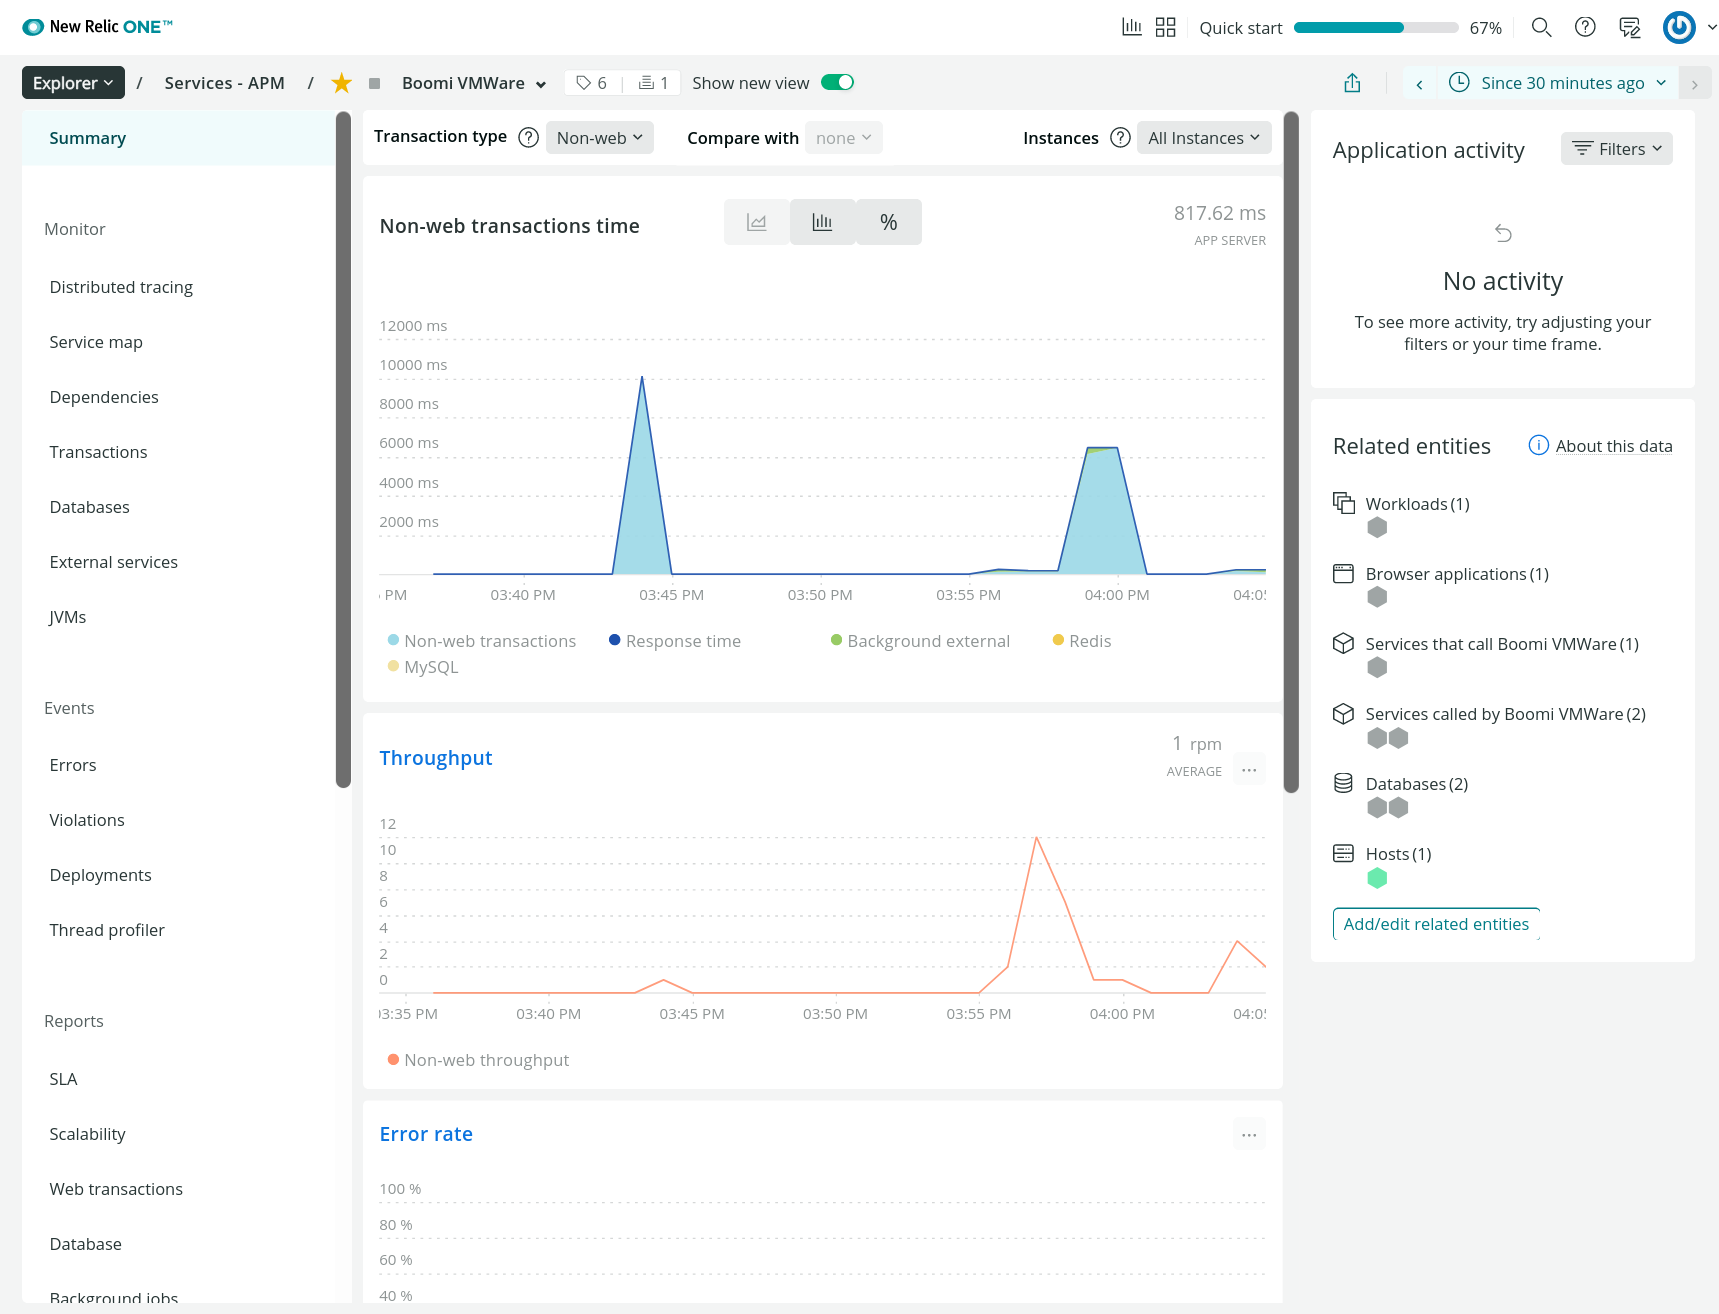
APM Overview
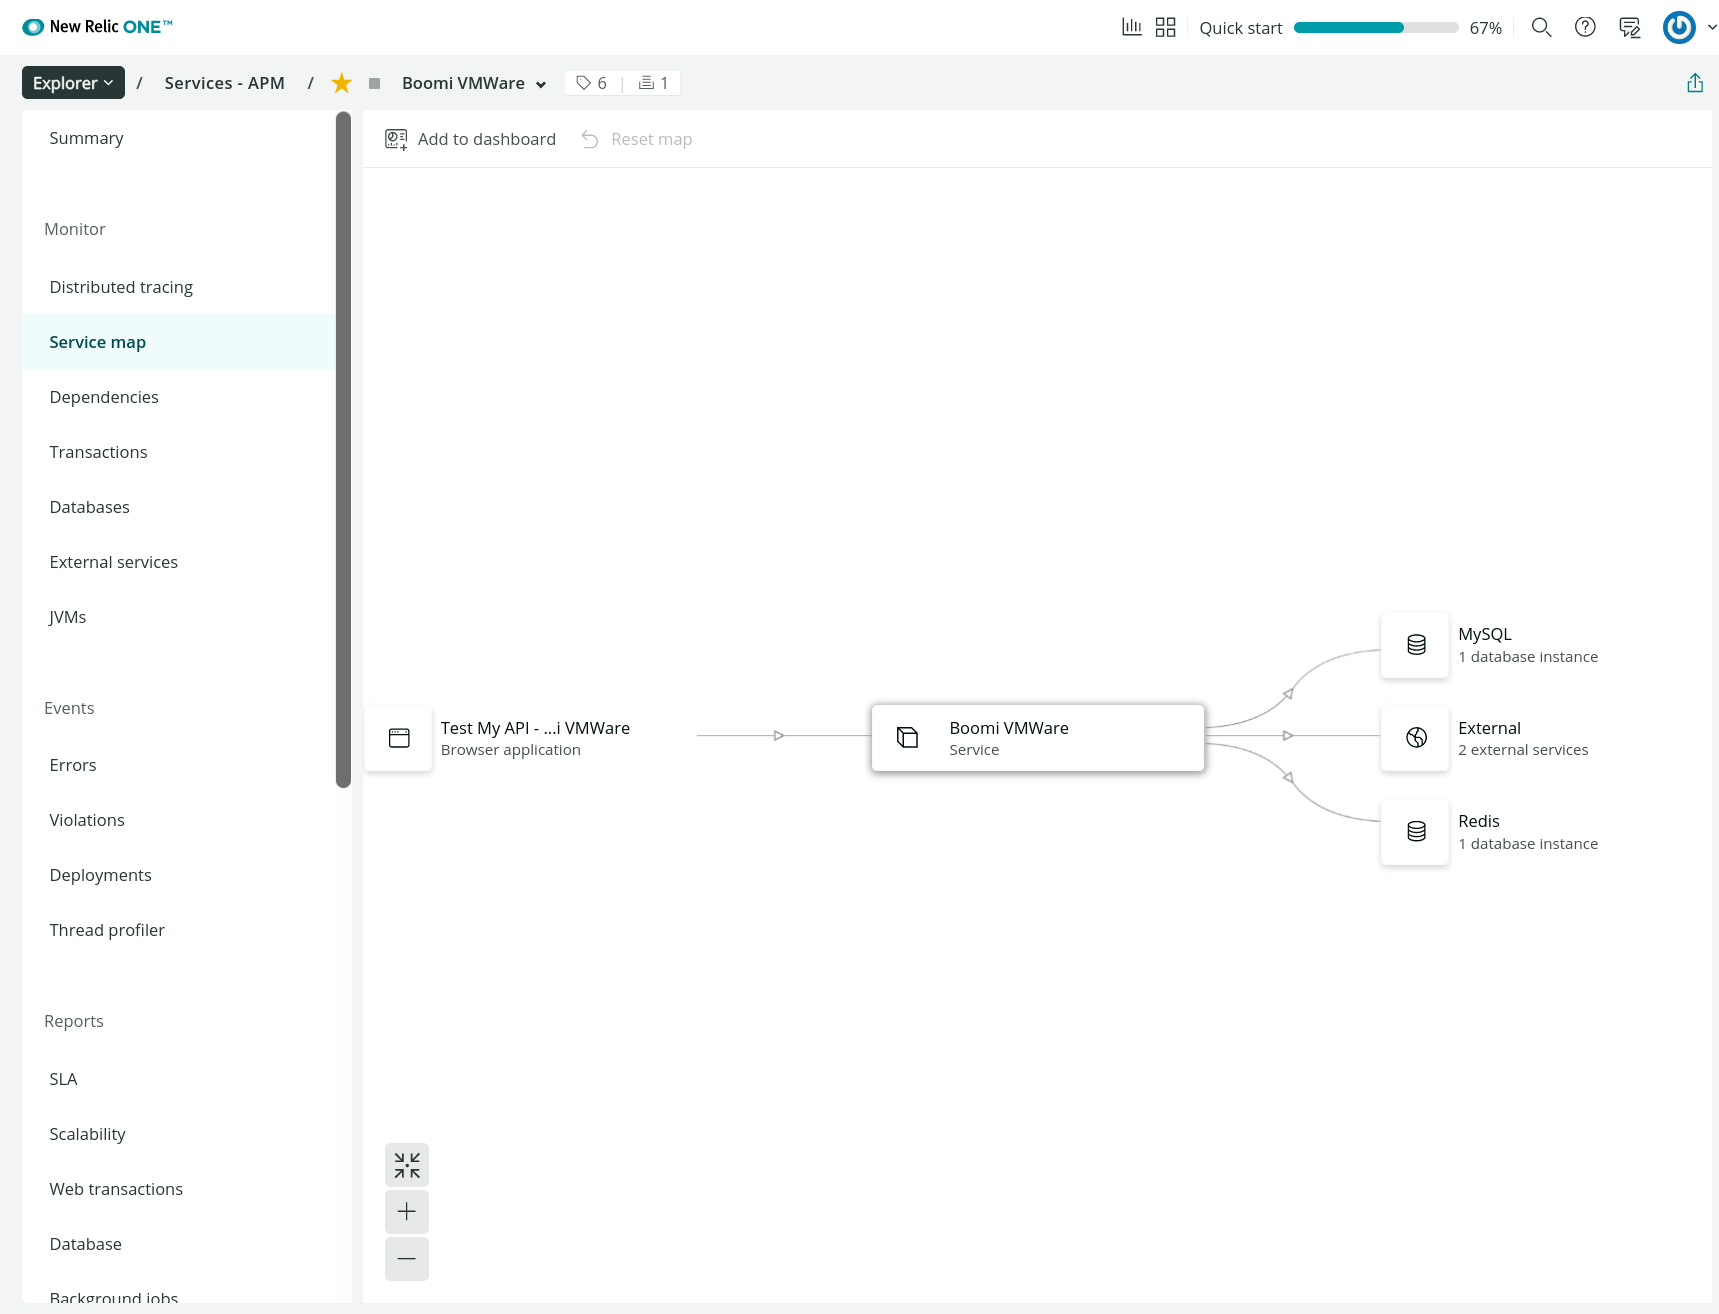
Service Map
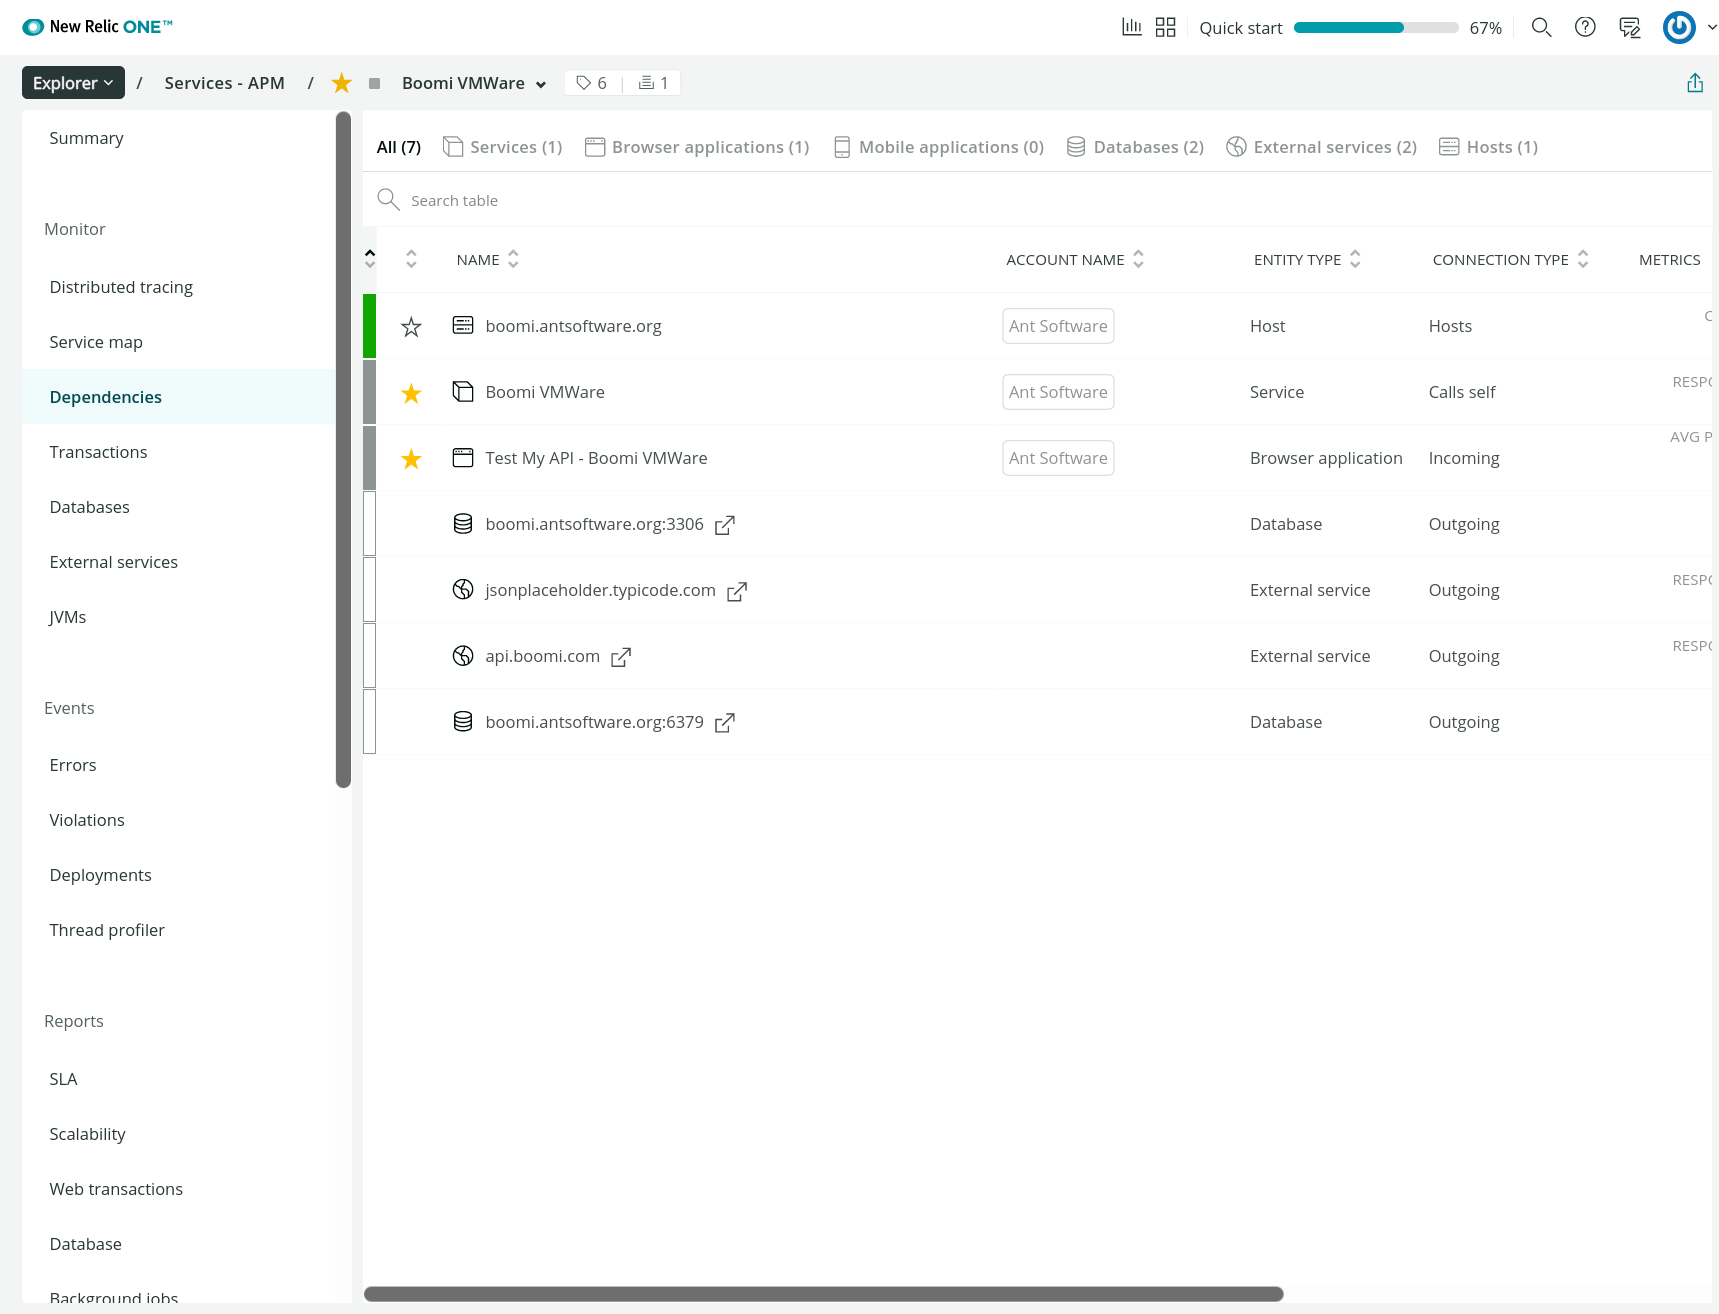
Dependencies
Transactions
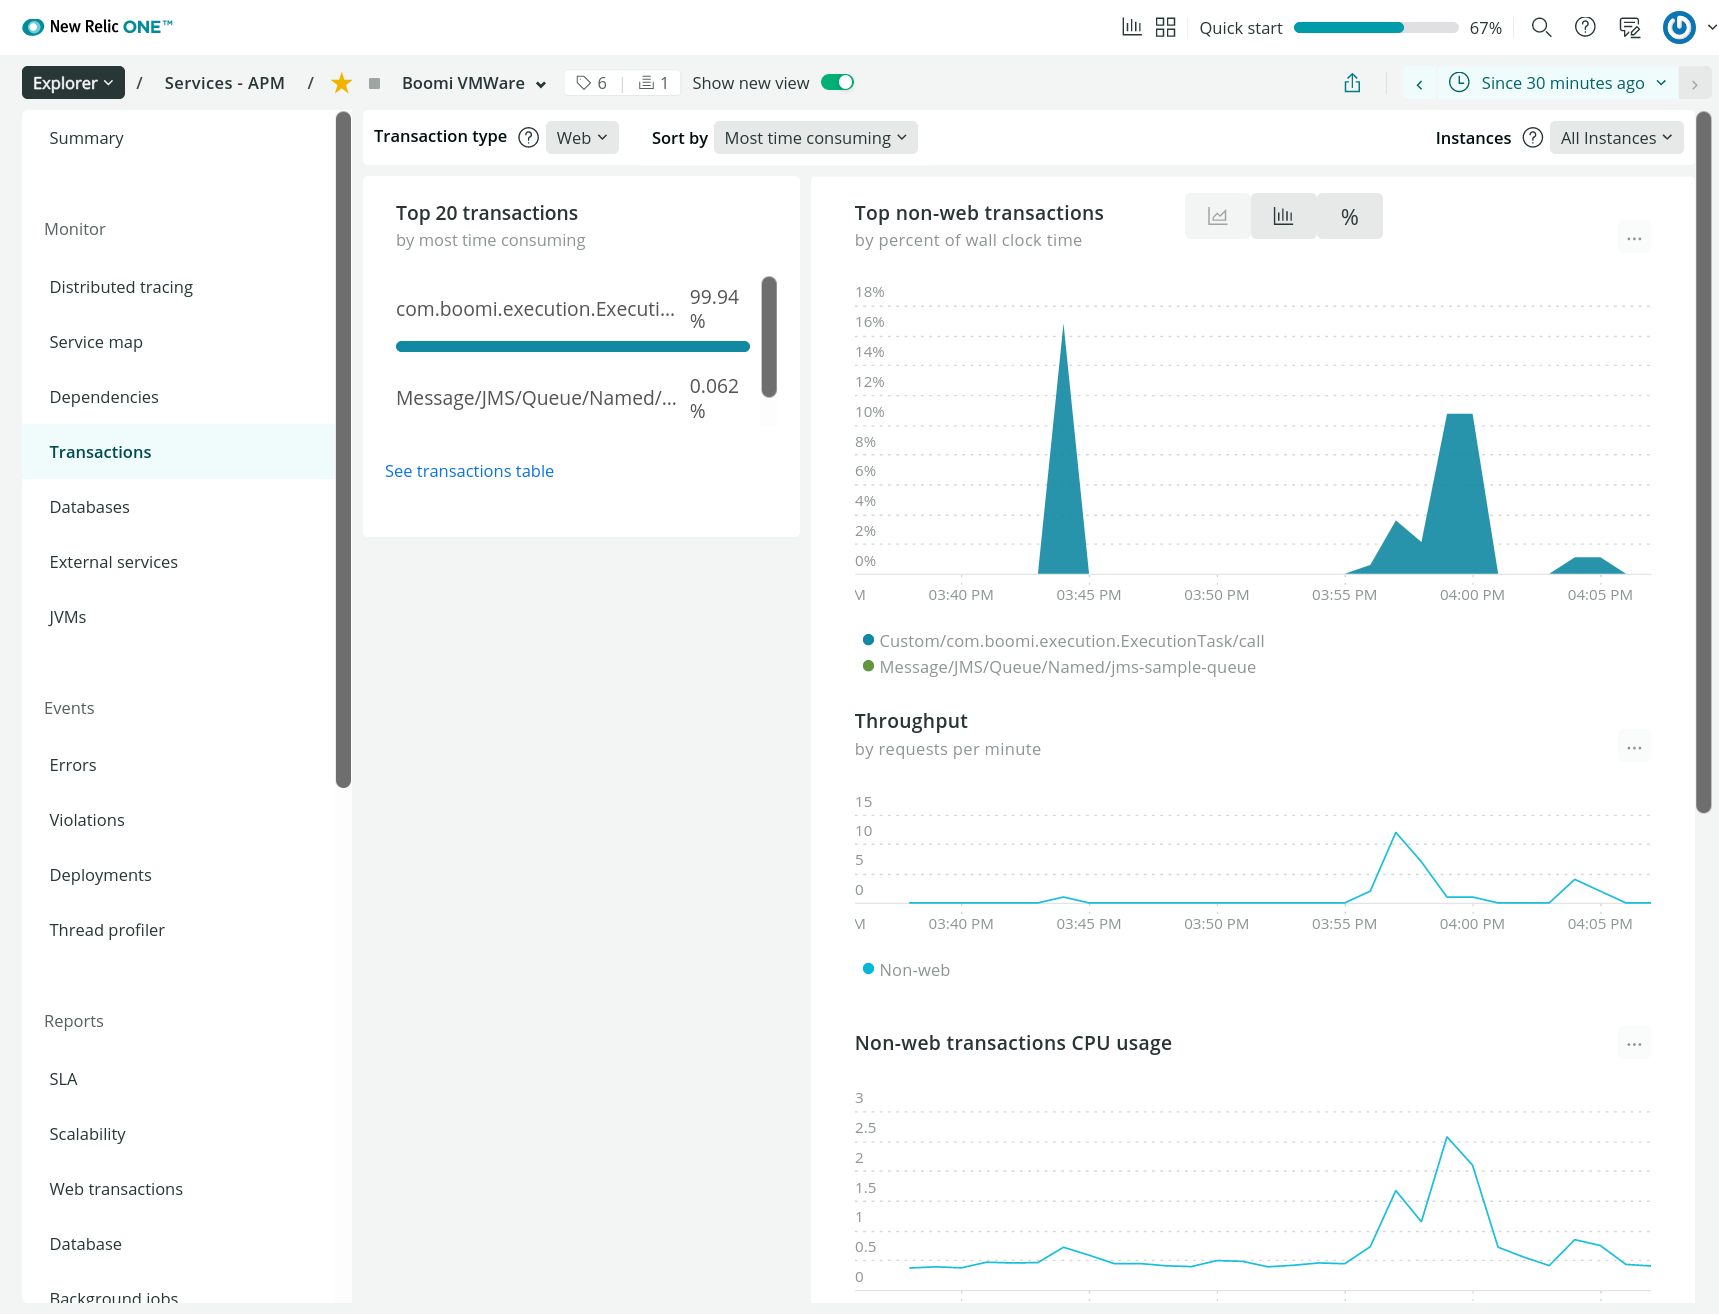
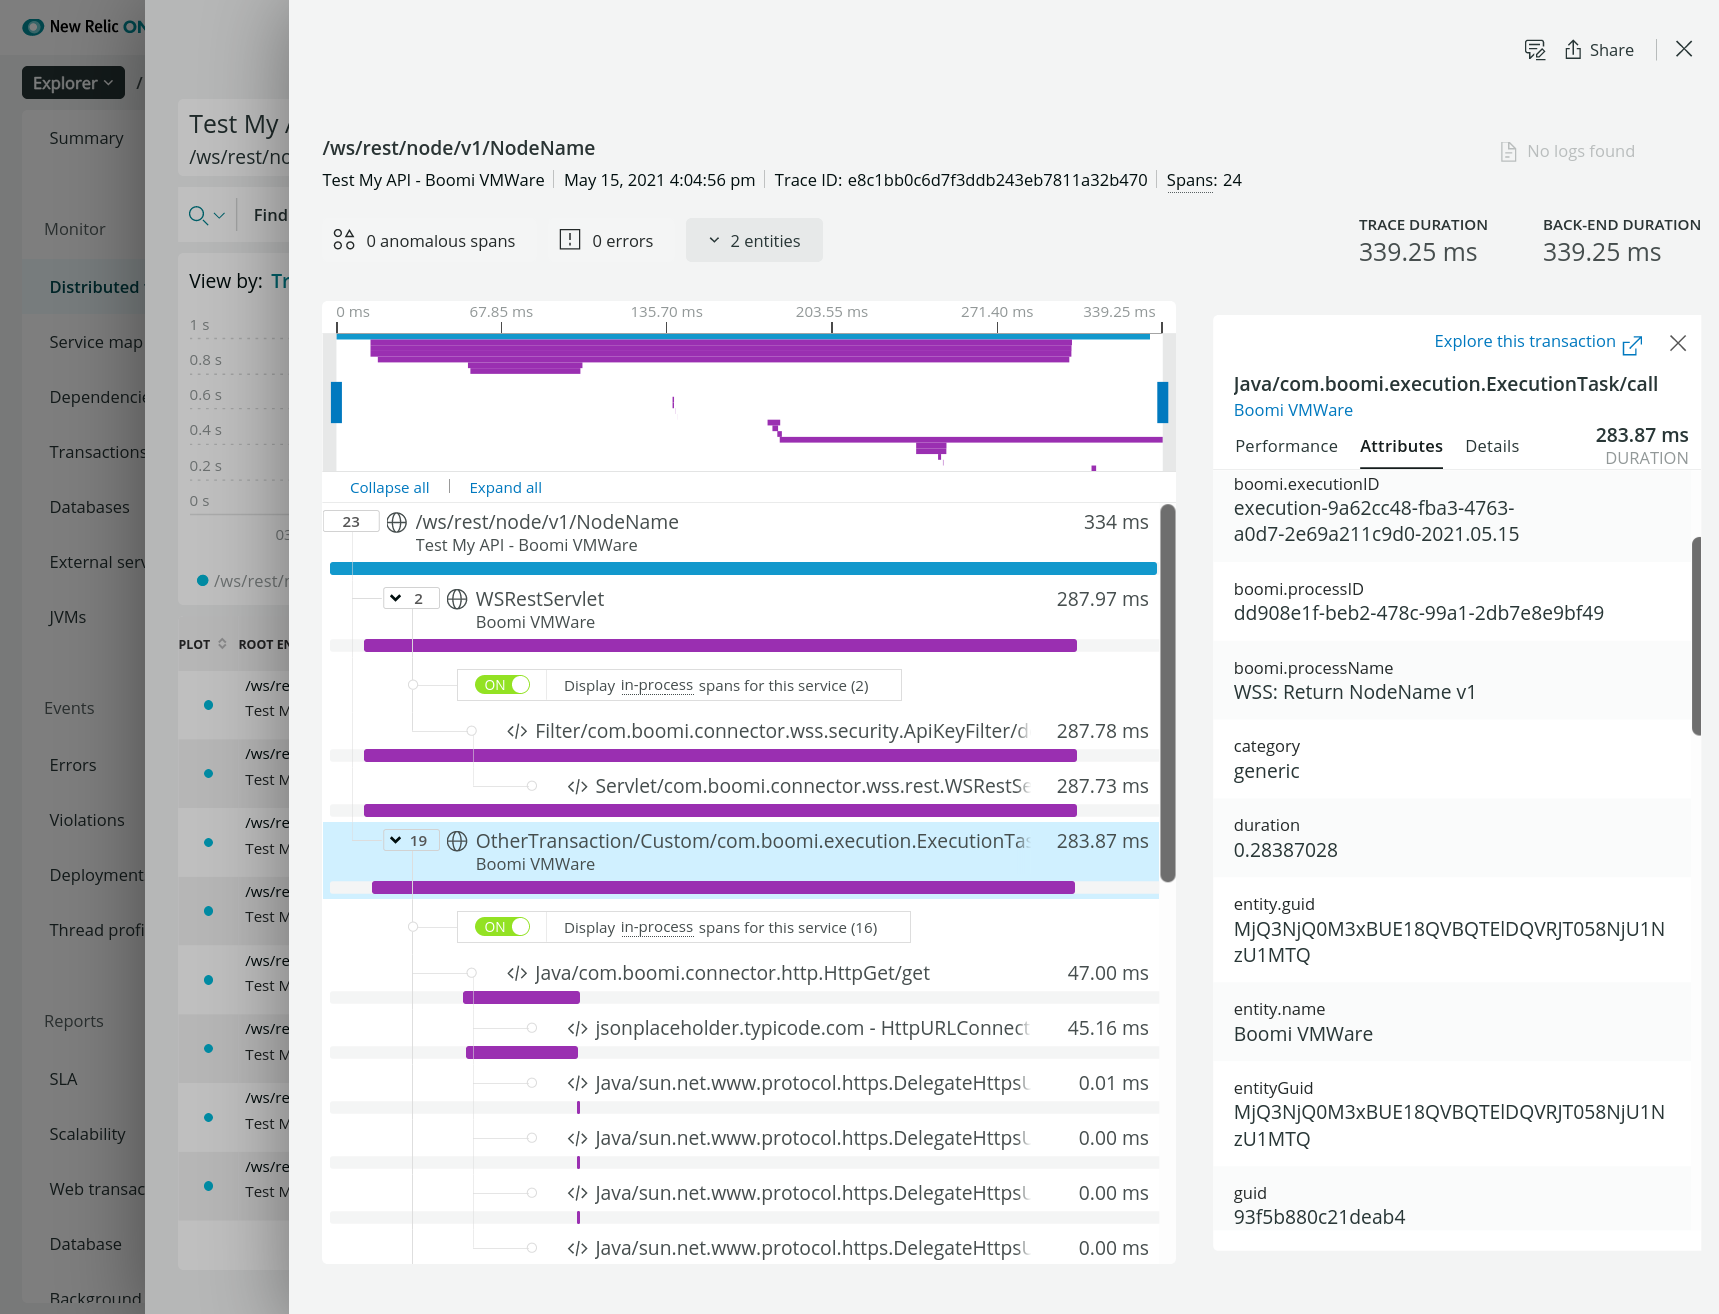
Distributed Tracing
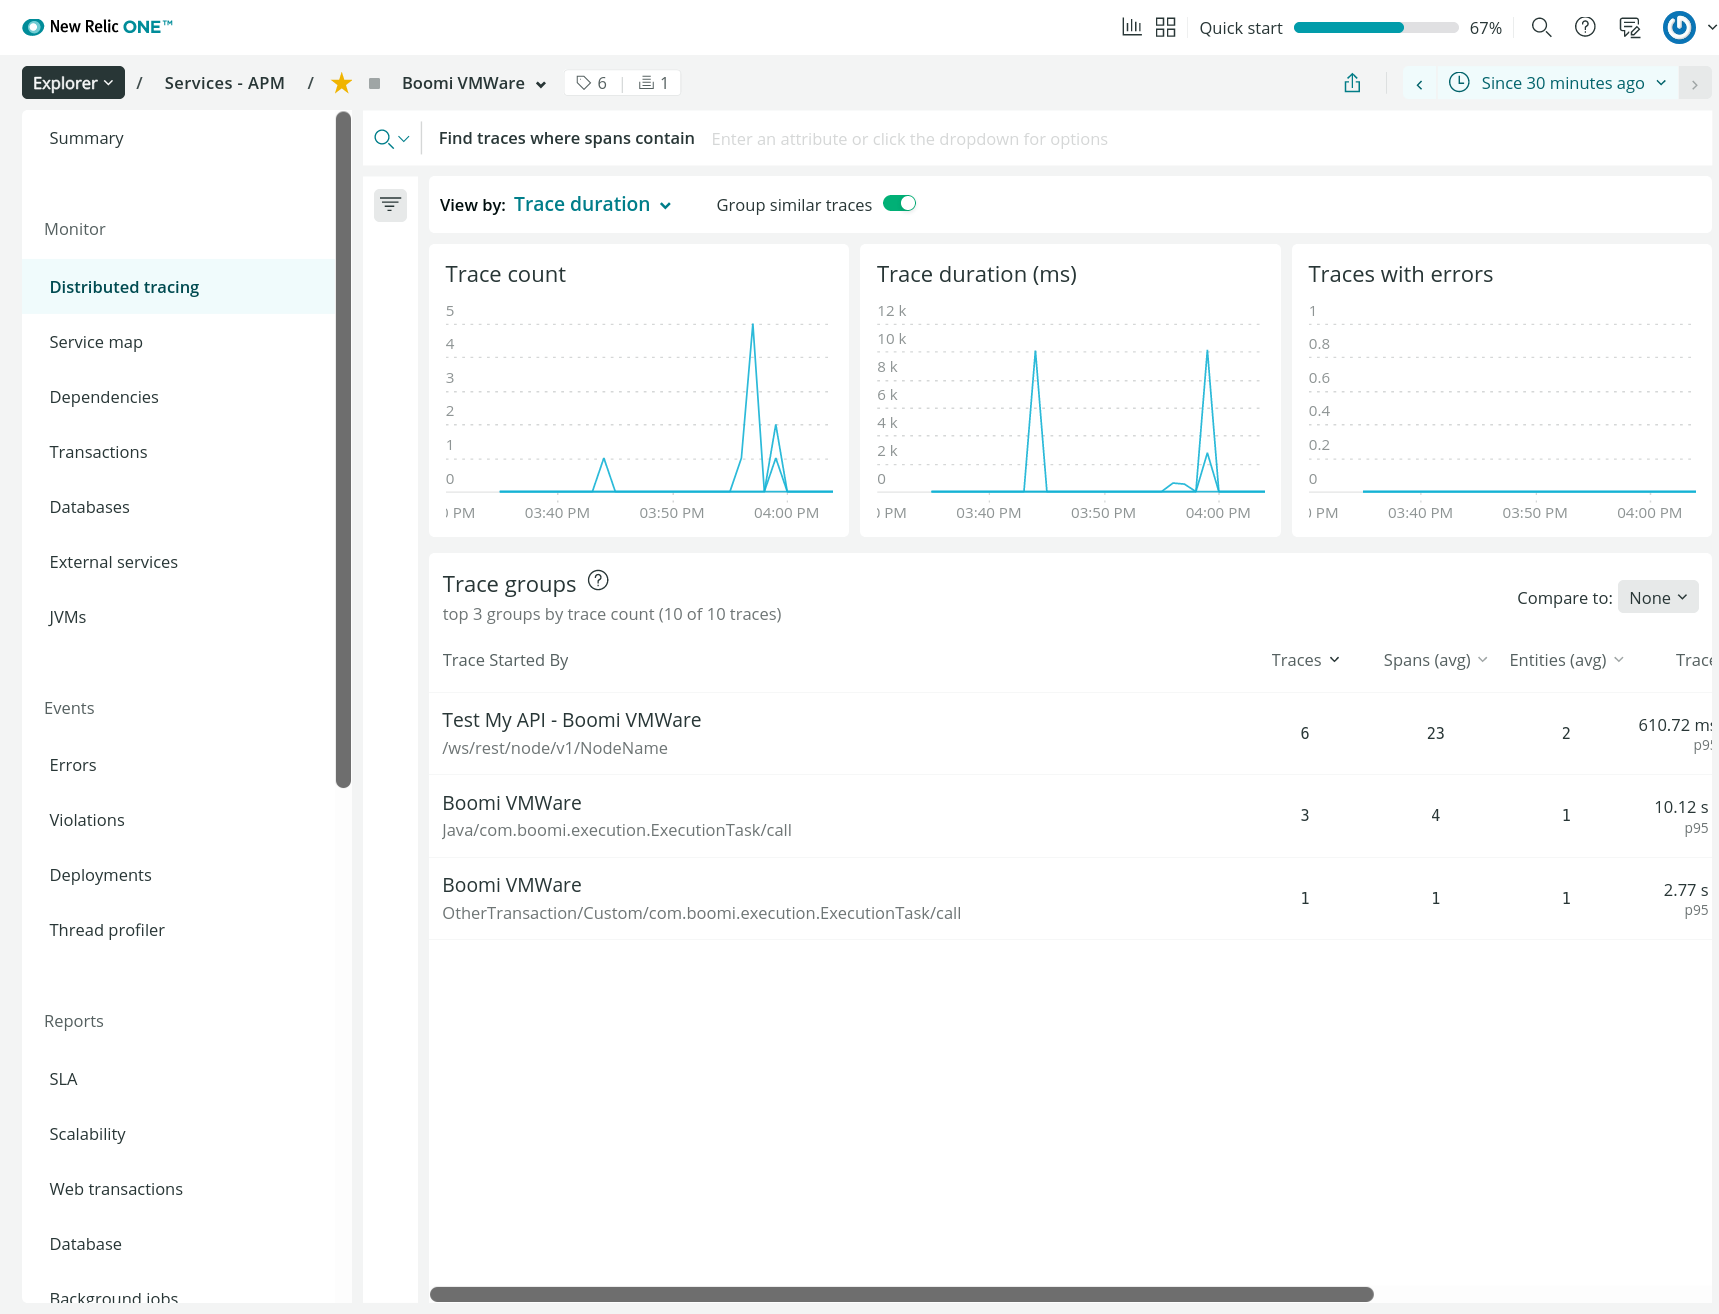
Traces
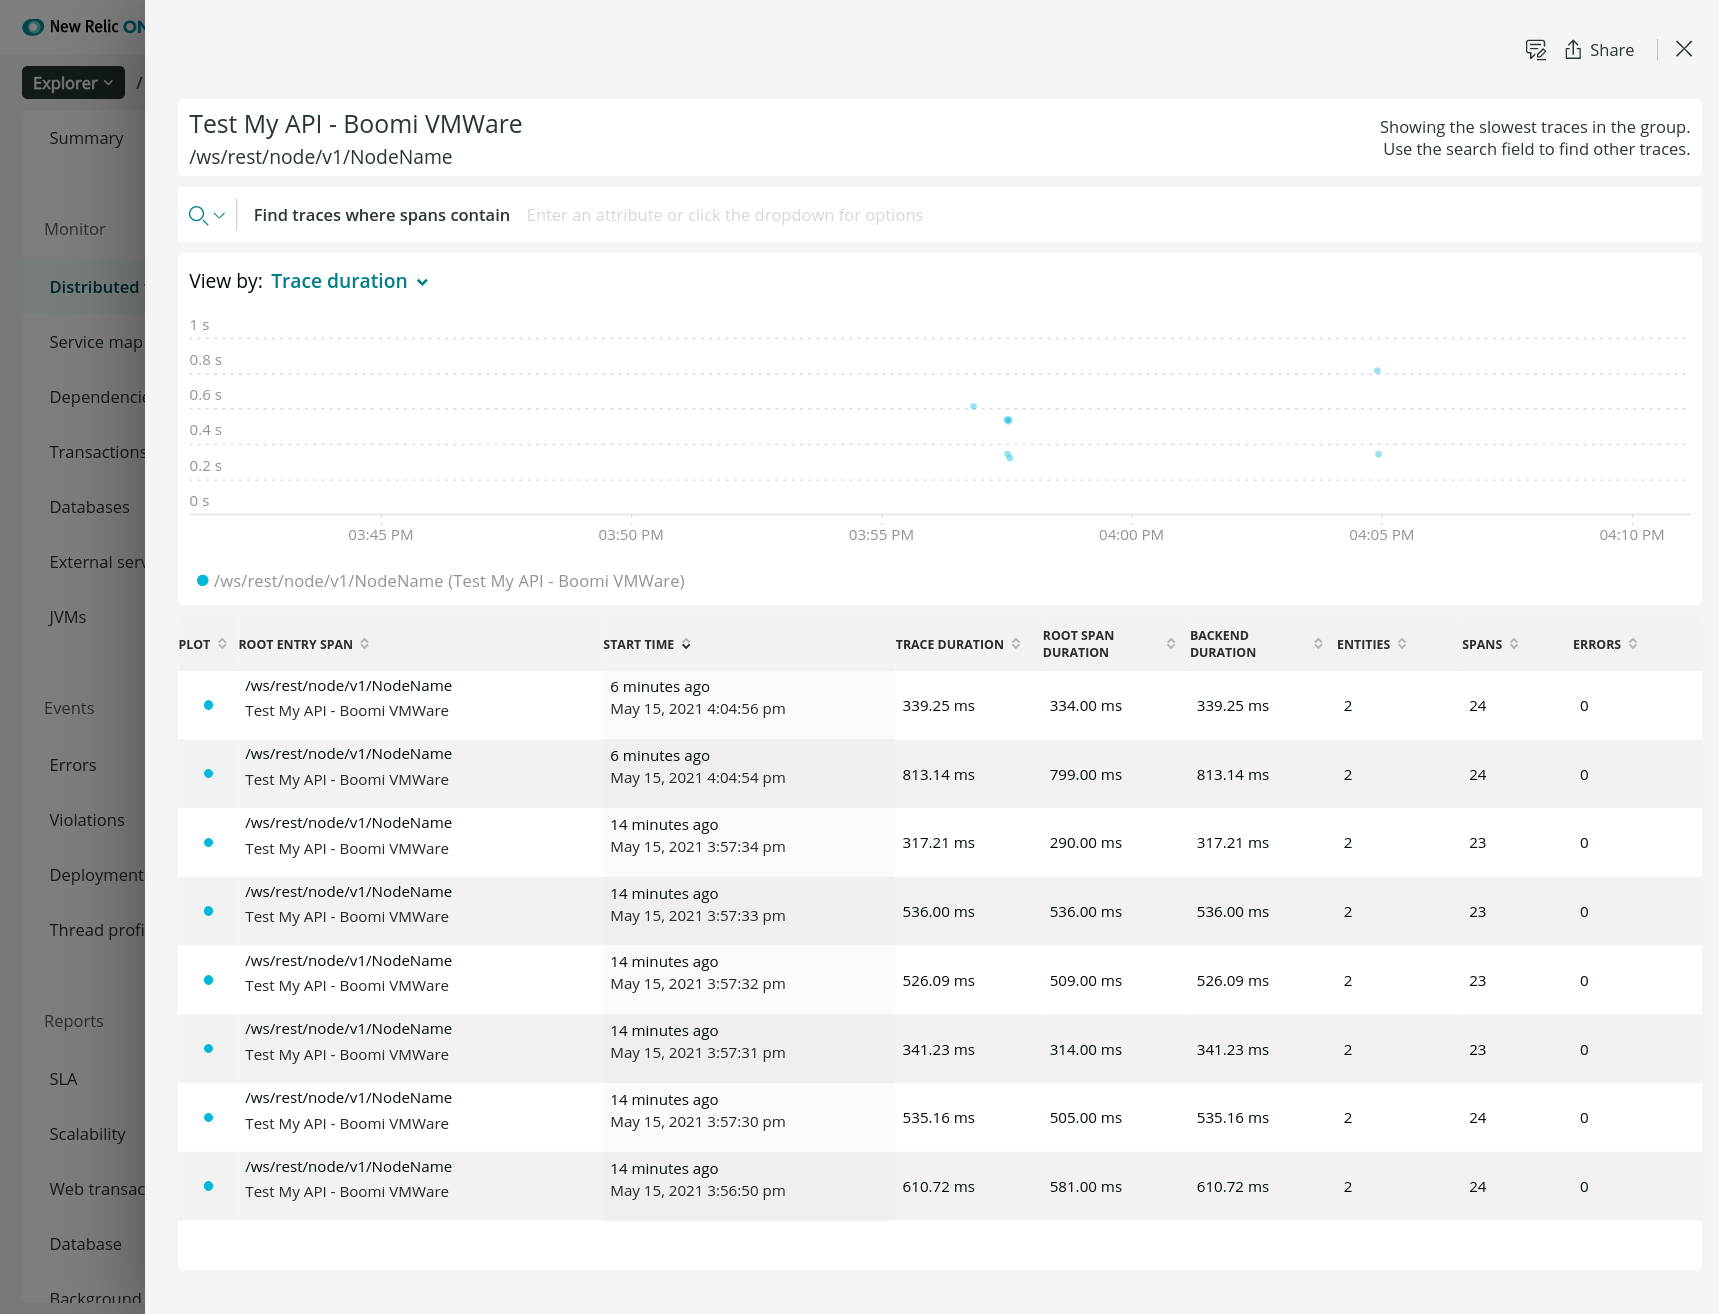
Detail of API and JMS Processes Correlated
We have an end-to-end view of the Processes:
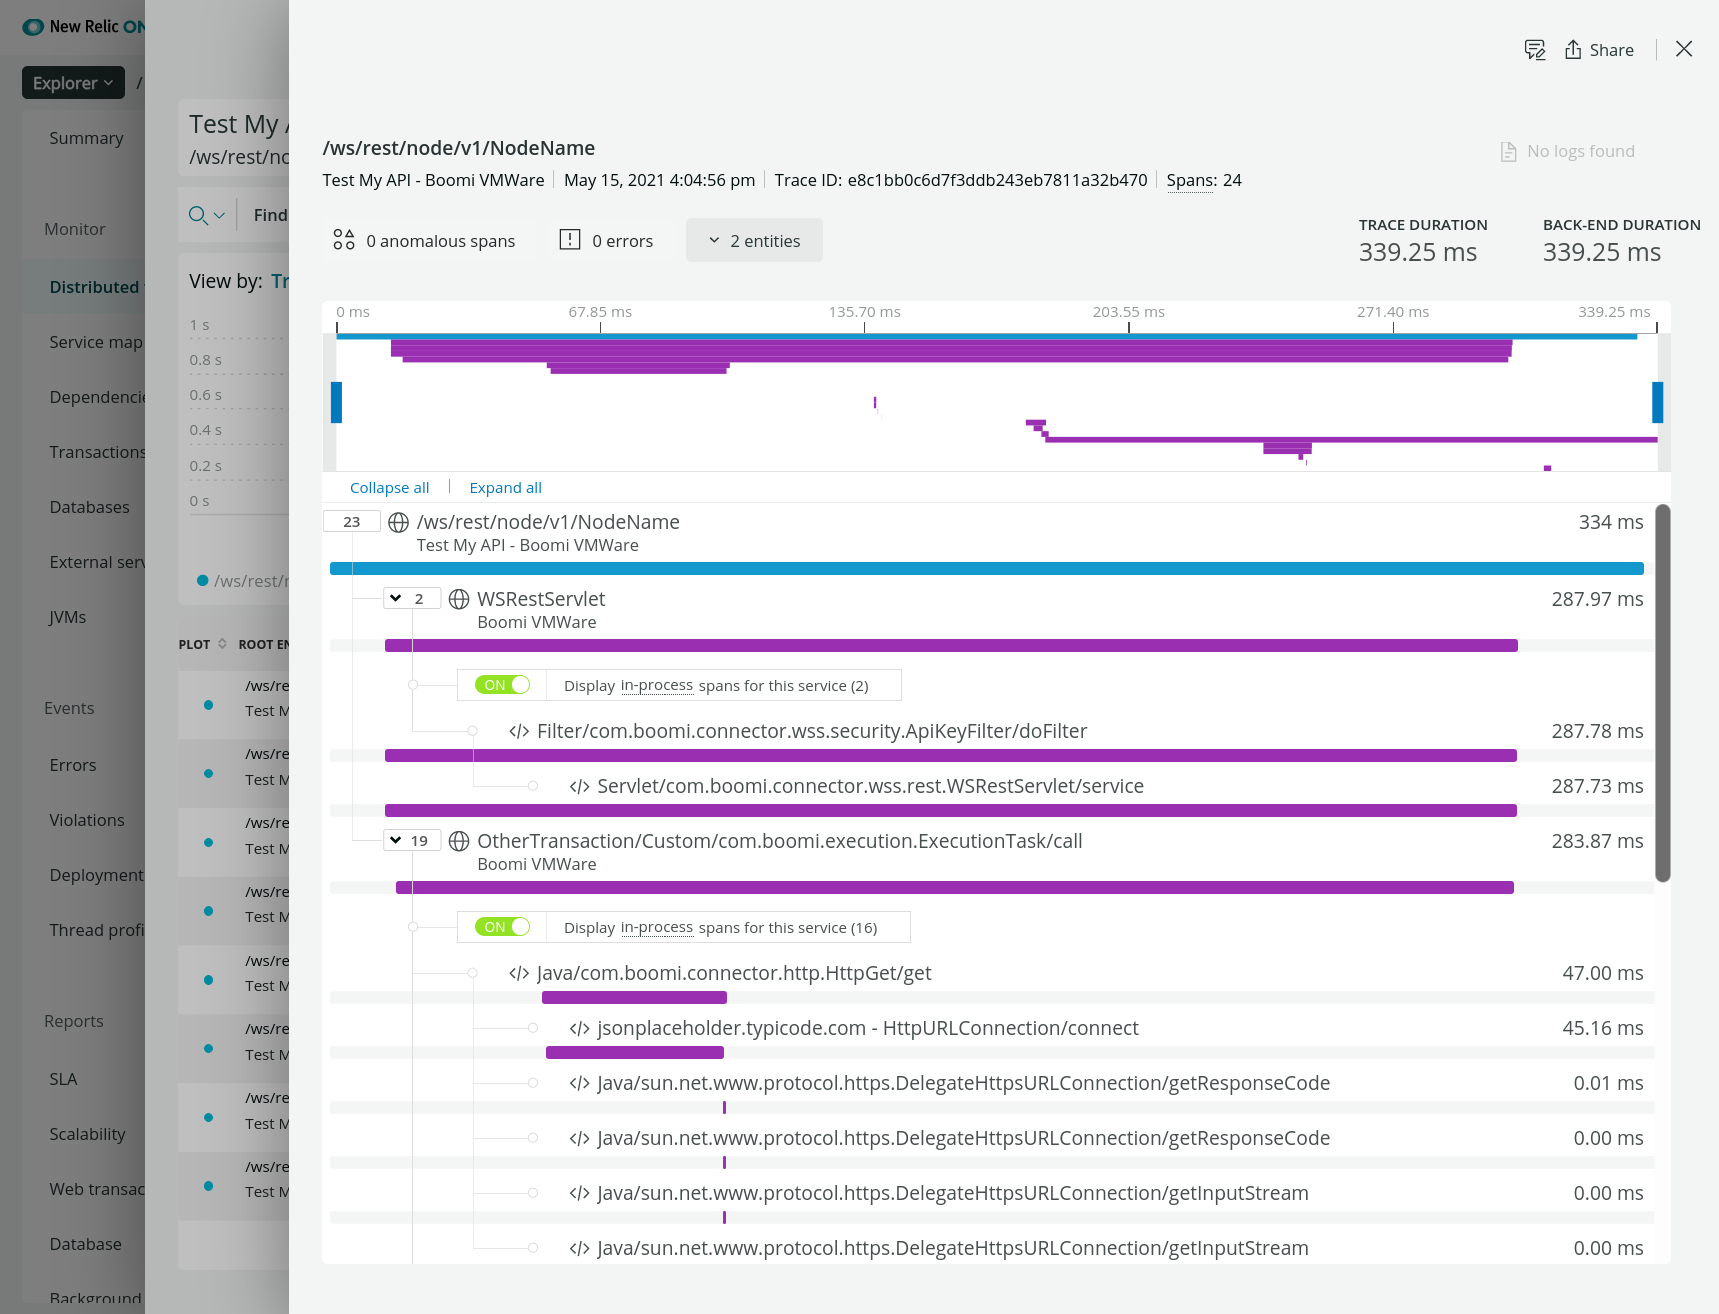
Metadata:
